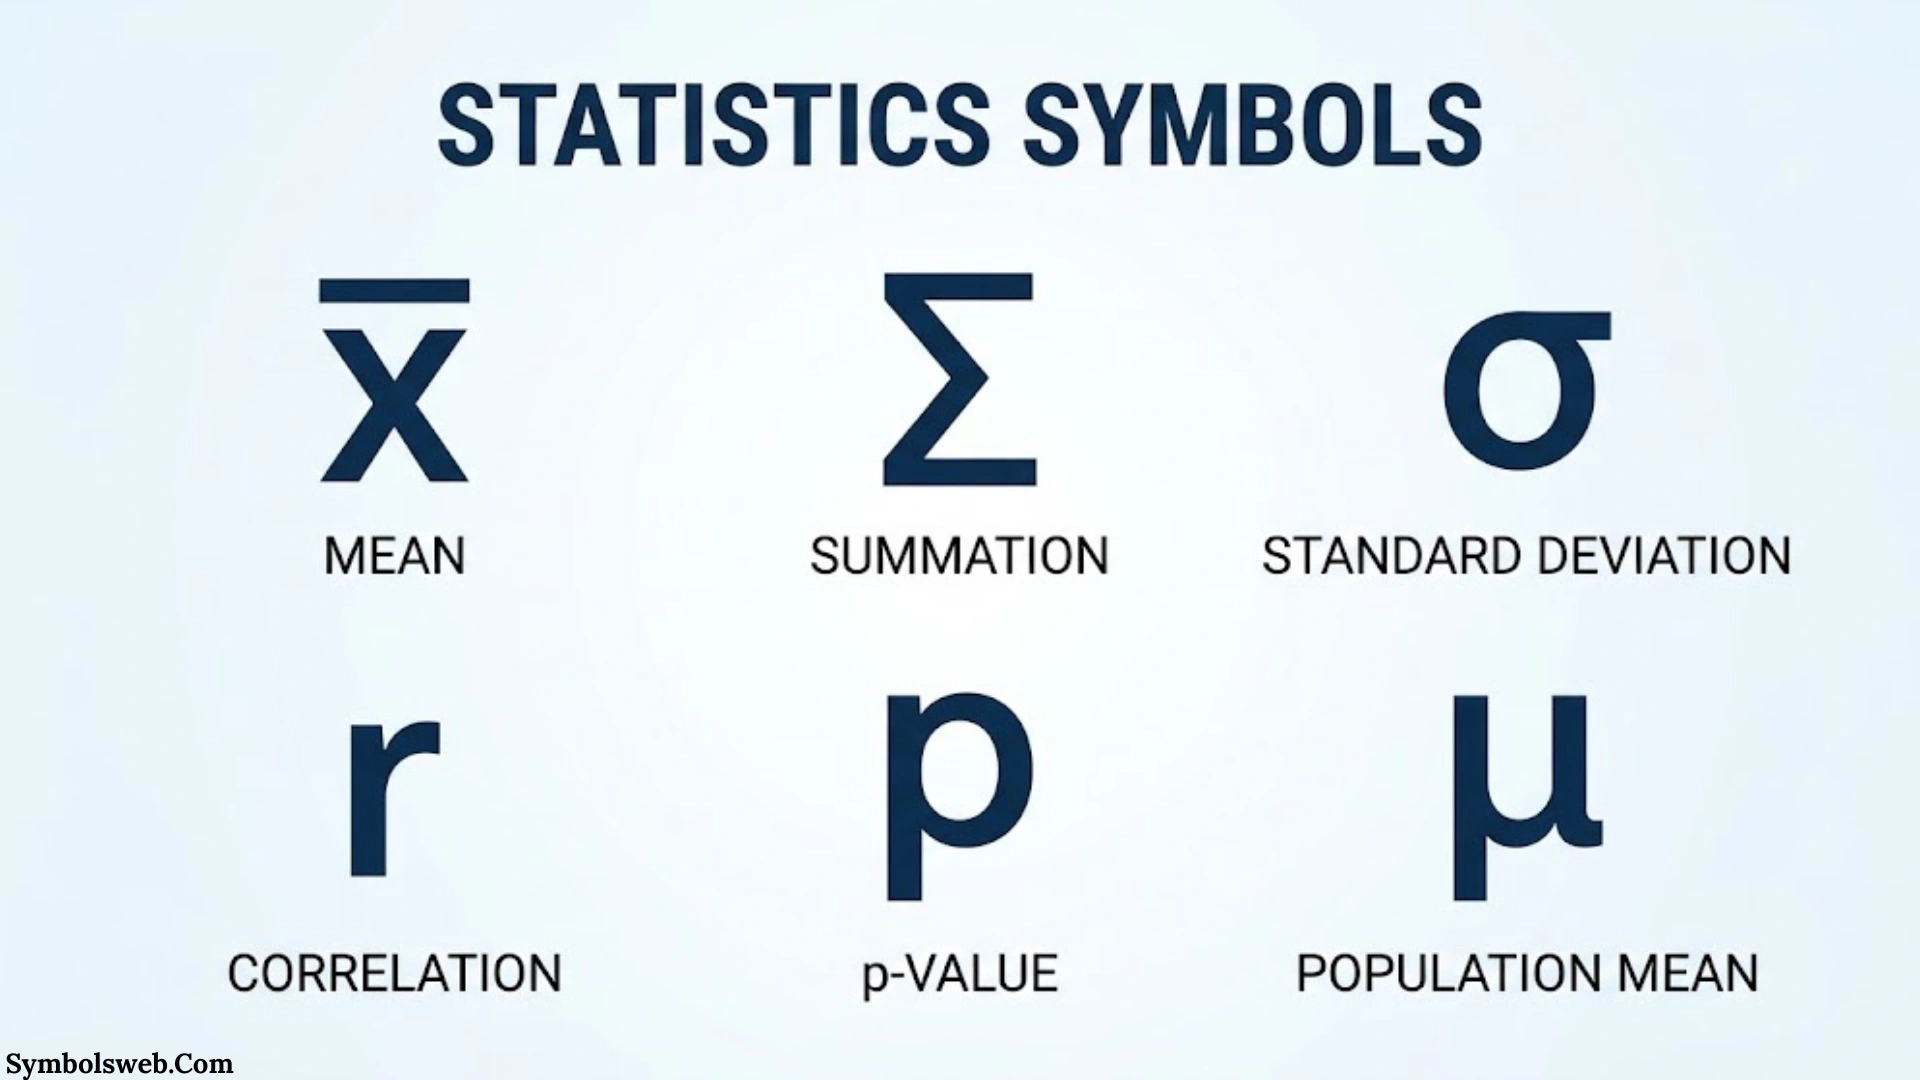
Statistics symbols make complicated mathematical ideas easier to understand. They help you describe data, calculate averages, measure variation, and test research hypotheses. However, learning statistical notation can feel confusing when Greek letters, Latin letters, subscripts, and mathematical operators appear together.
For example, the symbol μ represents a population mean while x̄ represents a sample mean. Similarly, σ describes population standard deviation and s represents sample standard deviation. Although these symbols look similar in purpose, they describe different statistical quantities.
Understanding statistics symbols and meanings helps you read textbooks, solve statistical problems, interpret research papers, and analyze real-world information. You don’t need to memorize every symbol at once. Start with common notation and gradually explore probability, hypothesis testing, correlation, and regression.
This guide covers the most important statistical symbols, their definitions, mathematical formulas, and practical examples. You’ll also find comparison tables and a statistics symbols cheat sheet for quick reference.
Statistics Symbols Cheat Sheet: Common Symbols and Their Meanings
A statistics symbols cheat sheet gives you a quick way to identify frequently used notation. These symbols appear in introductory statistics, academic research, probability calculations, and advanced statistical analysis.
The following table covers common statistical symbols and their basic meanings.
| Symbol | Name | Meaning |
| μ | Mu | Population mean |
| x̄ | X bar | Sample mean |
| σ | Sigma | Population standard deviation |
| s | Sample standard deviation | Sample standard deviation |
| σ² | Sigma squared | Population variance |
| s² | S squared | Sample variance |
| N | Population size | Number of members in a population |
| n | Sample size | Number of observations in a sample |
| Σ | Capital sigma | Summation operator |
| xᵢ | X sub i | Individual observation |
| M | Median | Middle value in an ordered dataset |
| Mo | Mode | Most frequent value |
| Q1 | First quartile | 25th percentile |
| Q2 | Second quartile | Median or 50th percentile |
| Q3 | Third quartile | 75th percentile |
| IQR | Interquartile range | Difference between Q3 and Q1 |
| CV | Coefficient of variation | Relative variability |
| SE | Standard error | Variability of a statistic’s sampling distribution |
| P(A) | Probability | Probability of event A |
| P(A ∪ B) | Union probability | Probability that A or B occurs |
| P(A ∩ B) | Intersection probability | Probability that A and B occur |
| P(A | B) | Conditional probability | Probability of A given B |
| Aᶜ | Complement | Event A does not occur |
| H₀ | Null hypothesis | Baseline hypothesis |
| H₁ / Hₐ | Alternative hypothesis | Hypothesis opposing the null |
| α | Alpha | Significance level |
| β | Beta | Type II error probability in hypothesis testing |
| 1 − β | Statistical power | Probability of rejecting a false null hypothesis |
| p | P-value | Probability of results at least as extreme under the null model |
| df | Degrees of freedom | Independent information available for a calculation |
| CI | Confidence interval | Interval estimate for a population parameter |
| t | T-statistic | Statistic associated with the t-distribution |
| z | Z-statistic | Standardized test statistic |
| χ² | Chi-square | Chi-square test statistic |
| F | F-statistic | Ratio of variance estimates |
| r | Pearson correlation | Sample correlation coefficient |
| ρ | Rho | Population correlation coefficient |
| R² | R-squared | Coefficient of determination |
| b₀ | B-zero | Estimated regression intercept |
| b₁ | B-one | Estimated regression slope |
| β₀ | Beta-zero | Population regression intercept |
| β₁ | Beta-one | Population regression slope |
| ŷ | Y-hat | Predicted response value |
| ε | Epsilon | Random error term |
| eᵢ | E sub i | Residual for observation i |
Remember: Statistical notation can vary between textbooks and disciplines. Always check how a particular author defines a symbol before interpreting it.
Understanding Statistical Notation: Population Parameters vs. Sample Statistics
Before studying individual symbols, understand the difference between a population and a sample. This distinction explains why statisticians use different letters for similar calculations.
What Is a Population in Statistics?
A population includes every individual, object, or observation covered by a particular statistical study.
For example, imagine a university has 5,000 enrolled students. If a researcher wants to study the average height of every student, all 5,000 students form the population.
A population can include:
- All students enrolled at a university.
- Every product manufactured by a factory during a specific period.
- All registered voters in a particular region.
- Every patient included in a defined medical study.
A numerical characteristic describing an entire population is called a population parameter.
What Is a Sample in Statistics?
A sample is a smaller group selected from a population. Researchers study samples when examining every population member would require too much time, money, or effort.
Suppose the university researcher measures 200 students instead of all 5,000. Those 200 students represent the sample.
A numerical measurement calculated from sample observations is called a sample statistic.
Difference Between Population Parameters and Sample Statistics
| Statistical concept | Population symbol | Sample symbol |
| Mean | μ | x̄ |
| Standard deviation | σ | s |
| Variance | σ² | s² |
| Size | N | n |
| Correlation | ρ | r |
Population parameters describe the complete group. Sample statistics summarize the selected observations and often help estimate population characteristics.
Why Do Statistics Use Greek and Latin Letters?
Statistics frequently uses Greek letters for population parameters and Latin letters for sample statistics.
For example:
- μ (mu): Population mean.
- x̄ (x-bar): Sample mean.
- σ (sigma): Population standard deviation.
- s: Sample standard deviation.
- ρ (rho): Population correlation.
- r: Sample correlation.
However, this convention isn’t universal. The letter β can represent a population regression coefficient or the probability of a Type II error. Context determines its meaning.
Descriptive Statistics Symbols and Their Meanings
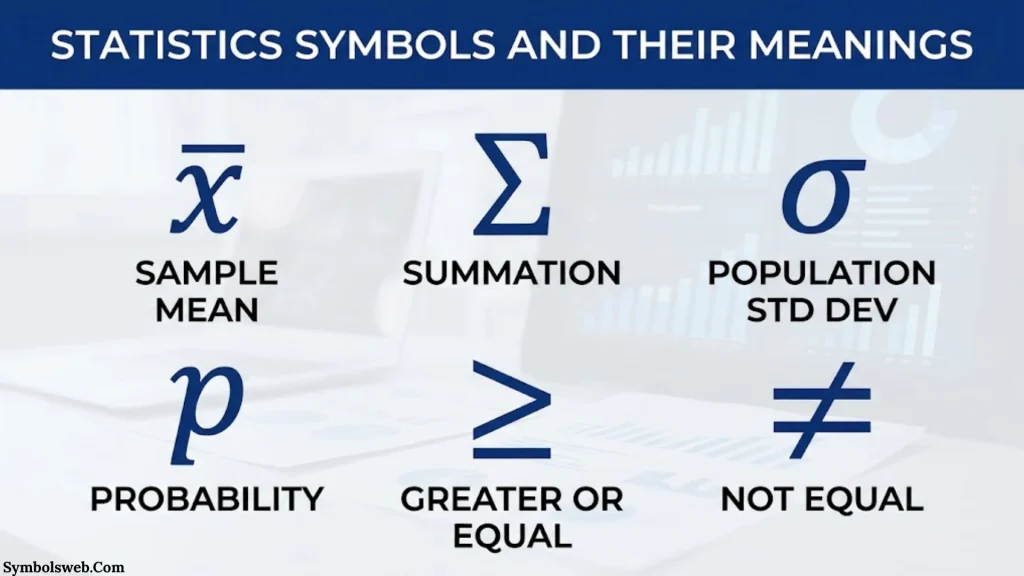
Descriptive statistics summarize and organize data so readers can understand important patterns. These statistical symbols describe central tendency, variability, and the distribution of observations.
Mean Symbols in Statistics: μ and x̄
The mean represents the arithmetic average of a dataset. It measures the central value by adding observations and dividing their total by the number of observations.
Two common mean symbols are:
- μ: Population mean.
- x̄: Sample mean.
The population mean formula is:
[
\mu=\frac{\sum_{i=1}^{N}x_i}{N}
]
The sample mean formula is:
[
\bar{x}=\frac{\sum_{i=1}^{n}x_i}{n}
]
Here:
- μ = Population mean.
- x̄ = Sample mean.
- Σ = Summation operator.
- xᵢ = Individual observation.
- N = Population size.
- n = Sample size.
Example: Suppose five students score 70, 75, 80, 85, and 90 on an exam.
[
\bar{x}=\frac{70+75+80+85+90}{5}=80
]
The sample mean is 80 points.
Median Symbols in Statistics: M and Mdn
The median is the middle value after arranging observations in ascending or descending order.
Some textbooks and statistical reports use M or Mdn to represent the median. These labels aren’t universal mathematical standards.
Consider these observations:
[
12,\ 15,\ 18,\ 21,\ 25
]
The middle observation is 18. Therefore, the median equals 18.
When a dataset contains an even number of observations, calculate the average of the two middle values.
Mode Symbol in Statistics: Mo
The mode represents the most frequently occurring observation in a dataset.
For example:
[
4,\ 5,\ 5,\ 6,\ 7,\ 5,\ 8
]
The value 5 appears three times. Therefore, the mode is 5.
A dataset can have:
- Unimodal distribution: One mode.
- Bimodal distribution: Two modes.
- Multimodal distribution: More than two modes.
- No mode: No observation occurs more frequently than the others.
The abbreviation Mo sometimes represents the mode.
Standard Deviation Symbols: σ and s
Standard deviation measures how far observations typically spread around their mean.
A small standard deviation indicates that observations tend to stay close to the average. A large standard deviation indicates greater variation.
| Symbol | Meaning |
| σ | Population standard deviation |
| s | Sample standard deviation |
The population standard deviation formula is:
[
\sigma=\sqrt{\frac{\sum_{i=1}^{N}(x_i-\mu)^2}{N}}
]
The sample standard deviation formula is:
[
s=\sqrt{\frac{\sum_{i=1}^{n}(x_i-\bar{x})^2}{n-1}}
]
The sample formula uses n − 1 in the denominator. This adjustment is called Bessel’s correction and helps produce an unbiased estimate of population variance under standard random-sampling assumptions.
Variance Symbols: σ² and s²
Variance measures the average squared deviation from the mean. It describes how widely observations spread around their central value.
The two common symbols are:
- σ²: Population variance.
- s²: Sample variance.
Population variance:
[
\sigma^2=\frac{\sum_{i=1}^{N}(x_i-\mu)^2}{N}
]
Sample variance:
[
s^2=\frac{\sum_{i=1}^{n}(x_i-\bar{x})^2}{n-1}
]
Variance uses squared units. For example, if measurements use inches, variance uses square inches.
Standard deviation takes the square root of variance. This returns the measurement to its original unit.
Summation Symbol in Statistics: Σ
The uppercase Greek letter sigma (Σ) represents summation. It instructs you to add a series of values.
For example:
[
\sum_{i=1}^{4}x_i=x_1+x_2+x_3+x_4
]
If the observations are 3, 5, 7, and 9:
[
\sum_{i=1}^{4}x_i=3+5+7+9=24
]
The components of summation notation include:
- Σ = Summation operator.
- i = Index variable.
- 1 = Starting value.
- 4 = Ending value.
- xᵢ = Individual term.
Don’t confuse uppercase Σ with lowercase σ. The first means addition while the second commonly represents population standard deviation.
Population Size (N) and Sample Size (n)
The letters N and n describe the number of observations in different groups.
| Symbol | Meaning | Example |
| N | Population size | 5,000 university students |
| n | Sample size | 200 selected students |
The distinction matters because many statistical formulas use sample size to estimate population characteristics.
Quartile and Interquartile Range Symbols: Q1, Q2, Q3, and IQR
Quartiles divide ordered data into four sections.
- Q1: First quartile or 25th percentile.
- Q2: Second quartile or median.
- Q3: Third quartile or 75th percentile.
- IQR: Interquartile range.
The interquartile range formula is:
[
IQR=Q3-Q1
]
Suppose Q1 equals 20 and Q3 equals 50.
[
IQR=50-20=30
]
The middle 50% of observations spans 30 units.
Quartiles also help identify potential outliers. A commonly used rule flags observations below Q1 − 1.5(IQR) or above Q3 + 1.5(IQR).
Different quartile calculation methods can produce slightly different results, especially with small datasets.
Coefficient of Variation Symbol: CV
The coefficient of variation (CV) measures relative variability compared with the mean.
Population coefficient of variation:
[
CV=\frac{\sigma}{\mu}\times100%
]
Sample coefficient of variation:
[
CV=\frac{s}{\bar{x}}\times100%
]
For example, a dataset has a sample mean of 50 and a sample standard deviation of 5.
[
CV=\frac{5}{50}\times100=10%
]
A coefficient of variation of 10% means the sample standard deviation equals 10% of its mean.
CV works best when measurements use a meaningful zero and the mean is positive and sufficiently far from zero.
Standard Error Symbol: SE
Standard error (SE) describes the variability of a statistic across repeated samples.
The standard error of the sample mean is commonly calculated as:
[
SE_{\bar{x}}=\frac{s}{\sqrt{n}}
]
Here:
- SE = Standard error.
- s = Sample standard deviation.
- n = Sample size.
Suppose a sample has a standard deviation of 12 and contains 36 observations.
[
SE=\frac{12}{\sqrt{36}}=\frac{12}{6}=2
]
The standard error is 2.
Standard deviation describes variation among individual observations. Standard error describes variation in a statistic’s sampling distribution. They’re related but serve different purposes.
Probability Symbols and Their Meanings
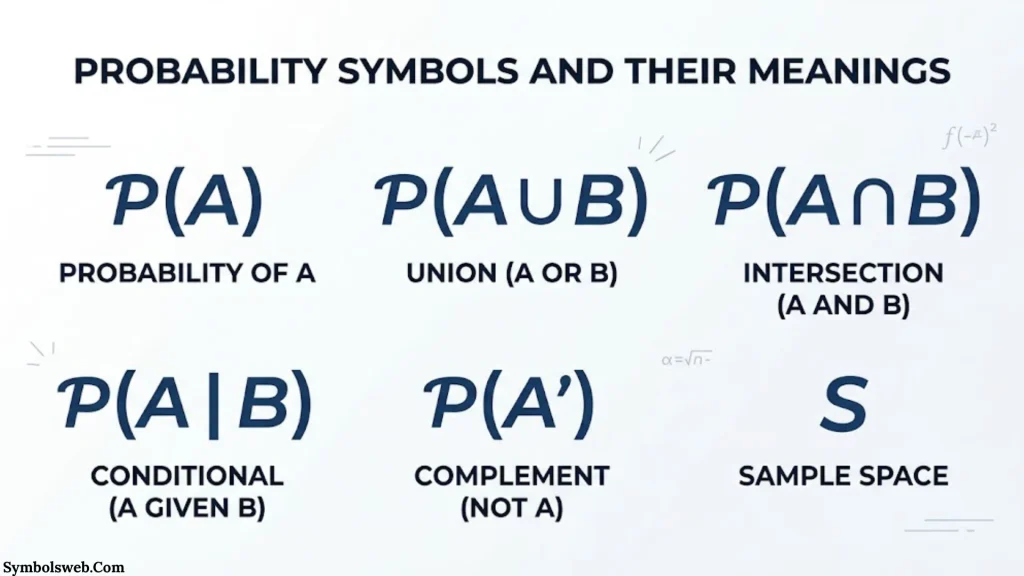
Probability theory studies the likelihood of events and possible outcomes. Its notation appears in statistics, scientific research, forecasting, and everyday decision-making.
Basic Probability Notation: P(A)
The expression P(A) represents the probability that event A occurs.
For an equally likely finite sample space:
[
P(A)=\frac{\text{Number of favorable outcomes}}{\text{Total possible outcomes}}
]
For example, a standard deck contains 52 playing cards. Thirteen are hearts.
[
P(\text{Heart})=\frac{13}{52}=0.25
]
Therefore, the probability of drawing a heart is 25%.
Probability values range from 0 to 1:
- 0 means an impossible event.
- 0.5 means a 50% probability.
- 1 means a certain event.
Union Symbol (∪): Probability of A or B
The union symbol ∪ represents the combination of two events.
[
P(A\cup B)
]
This expression means the probability that event A occurs, event B occurs, or both occur.
The general addition rule is:
[
P(A\cup B)=P(A)+P(B)-P(A\cap B)
]
The intersection gets subtracted because the addition initially counts overlapping outcomes twice.
Intersection Symbol (∩): Probability of A and B
The intersection symbol ∩ represents outcomes shared by two events.
[
P(A\cap B)
]
It describes the probability that both events occur.
For example, drawing one card from a standard deck:
- Event A: Drawing a heart.
- Event B: Drawing a king.
Only the king of hearts satisfies both conditions.
[
P(A\cap B)=\frac{1}{52}
]
Conditional Probability Symbol: P(A | B)
The vertical bar represents the phrase “given that” in probability notation.
[
P(A\mid B)
]
This expression means the probability of A occurring when B has already occurred.
The conditional probability formula is:
[
P(A\mid B)=\frac{P(A\cap B)}{P(B)}
]
This formula applies when P(B) is greater than zero.
Example: A standard deck contains 13 hearts. One card is selected and you’re told it’s a heart. The probability that it’s the king of hearts becomes:
[
P(\text{King}\mid\text{Heart})=\frac{1}{13}
]
The additional information changes the probability calculation.
Complement Symbol: Aᶜ
The complement symbol represents an event not occurring.
[
P(A^c)=1-P(A)
]
Suppose the probability of rain tomorrow is 0.30.
[
P(\text{No rain})=1-0.30=0.70
]
Therefore, the probability of no rain is 70%.
Independent and Dependent Events
Two events are independent when one event doesn’t change the probability of the other.
For independent events:
[
P(A\cap B)=P(A)\times P(B)
]
Dependent events behave differently because the occurrence of one event changes the probability of another.
For example, drawing two cards without replacement creates dependent events. The first card changes the remaining deck.
Important distinction: Independent events aren’t the same as mutually exclusive events. Mutually exclusive events cannot occur together while independent events can occur together.
Other Important Probability Symbols
| Symbol | Meaning |
| P(X = x) | Probability that random variable X equals x |
| P(X ≤ x) | Probability that X is at most x |
| E(X) | Expected value of random variable X |
| Var(X) | Variance of random variable X |
| f(x) | Probability mass or density function, depending on context |
| F(x) | Cumulative distribution function |
| X ~ N(μ, σ²) | X follows a normal distribution with mean μ and variance σ² |
Common Probability Distributions and Their Notation
Probability distributions describe how possible values of a random variable are distributed.
| Distribution | Common notation | Typical application |
| Normal | X ~ N(μ, σ²) | Continuous measurements |
| Standard normal | Z ~ N(0, 1) | Standardized values |
| Binomial | X ~ Bin(n, p) | Number of successes in fixed trials |
| Poisson | X ~ Pois(λ) | Event counts over a fixed interval |
| Uniform | X ~ U(a, b) | Equally likely values over an interval |
| Exponential | X ~ Exp(λ) | Waiting times between events |
| Student’s t | t(df) | Inference involving estimated standard errors |
| Chi-square | χ²(df) | Variance-related and categorical-data tests |
| F-distribution | F(df₁, df₂) | Variance ratios and ANOVA |
The exact parameterization can vary between textbooks. For example, exponential distributions may use a rate parameter or a scale parameter.
Hypothesis Testing Symbols and Their Meanings
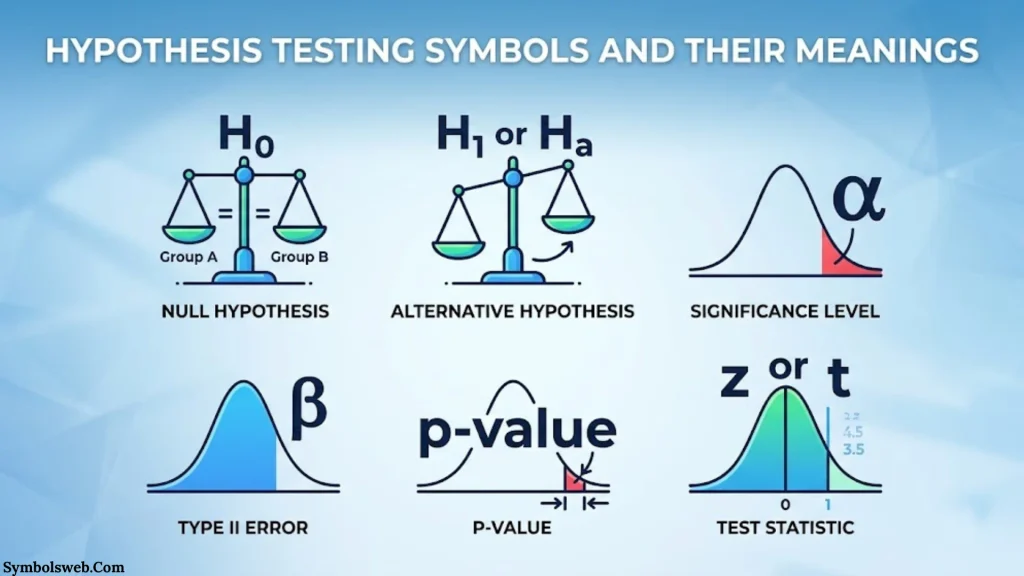
Hypothesis testing uses sample evidence to evaluate claims about population parameters. Its notation helps researchers describe assumptions, measure uncertainty, and make statistical decisions.
Null Hypothesis Symbol: H₀
The null hypothesis (H₀) represents the baseline claim tested in a statistical procedure.
For example:
[
H_0:\mu=50
]
This statement claims that the population mean equals 50.
A hypothesis test evaluates whether the sample provides sufficient evidence against that claim.
Alternative Hypothesis Symbol: H₁ or Hₐ
The alternative hypothesis represents a claim that conflicts with the null hypothesis.
Common forms include:
- Two-sided: Hₐ: μ ≠ 50.
- Right-tailed: Hₐ: μ > 50.
- Left-tailed: Hₐ: μ < 50.
The null and alternative hypotheses must reflect the research question and the statistical test.
Hypothesized Population Mean: μ₀
The symbol μ₀ (mu-zero) represents a reference value for a population mean under the null hypothesis.
For example:
[
H_0:\mu=\mu_0=50
]
Here, μ represents the unknown population mean while μ₀ represents the hypothesized value.
Significance Level Symbol: α
The Greek letter alpha (α) represents the significance level in hypothesis testing.
Common significance levels include:
- 0.10 or 10%.
- 0.05 or 5%.
- 0.01 or 1%.
A significance level of 0.05 sets a 5% Type I error rate under the testing procedure’s assumptions.
Researchers generally select α before examining the test results.
P-Value Symbol: p
The p-value measures how unusual the observed test result would be under the null hypothesis.
More precisely, it represents the probability of obtaining a test statistic at least as extreme as the observed one, assuming the null model and its assumptions hold.
For example, a p value of 0.02 indicates a 2% probability of obtaining results at least as extreme under the null model.
A p-value doesn’t tell you the probability that the null hypothesis is true.
Beta Symbol: β and Type II Error
The Greek letter beta (β) represents the probability of a Type II error in hypothesis testing.
A Type II error occurs when a statistical test fails to reject a false null hypothesis.
For example, a medical study might fail to detect a genuine treatment effect because its sample provides insufficient evidence.
The probability of this error depends on factors such as sample size, effect size, variability, and significance level.
Statistical Power Symbol: 1 − β
Statistical power represents the probability of rejecting a false null hypothesis under a specified alternative.
[
\text{Power}=1-\beta
]
If β equals 0.20:
[
1-0.20=0.80
]
The statistical power is 80%.
Researchers often use power analysis to estimate the sample size needed to detect an effect of practical interest.
Type I and Type II Error Symbols
| Error | Symbol | Meaning |
| Type I error | α | Rejecting a true null hypothesis |
| Type II error | β | Failing to reject a false null hypothesis |
| Statistical power | 1 − β | Rejecting a false null hypothesis |
A Type I error resembles a false alarm. A Type II error resembles a missed detection.
Degrees of Freedom Symbol: df
Degrees of freedom (df) describe the number of independent pieces of information available for a particular calculation.
For a sample variance:
[
df=n-1
]
If a sample contains 20 observations:
[
df=20-1=19
]
Degrees of freedom differ between tests. A two-sample t-test, chi-square test, and ANOVA don’t necessarily use the same calculation.
Confidence Interval Symbol: CI
A confidence interval (CI) provides an interval estimate for an unknown population parameter.
A general confidence interval for a population mean with an estimated standard error is:
[
\bar{x}\pm t^*\frac{s}{\sqrt{n}}
]
Here:
- x̄ = Sample mean.
- t* = Critical t-value.
- s = Sample standard deviation.
- n = Sample size.
A 95% confidence interval means the interval-building procedure captures the true parameter in approximately 95% of repeated samples under its assumptions.
It doesn’t mean there’s a 95% probability that a fixed population parameter falls inside one calculated frequentist interval.
Statistical Test Symbols and Their Applications
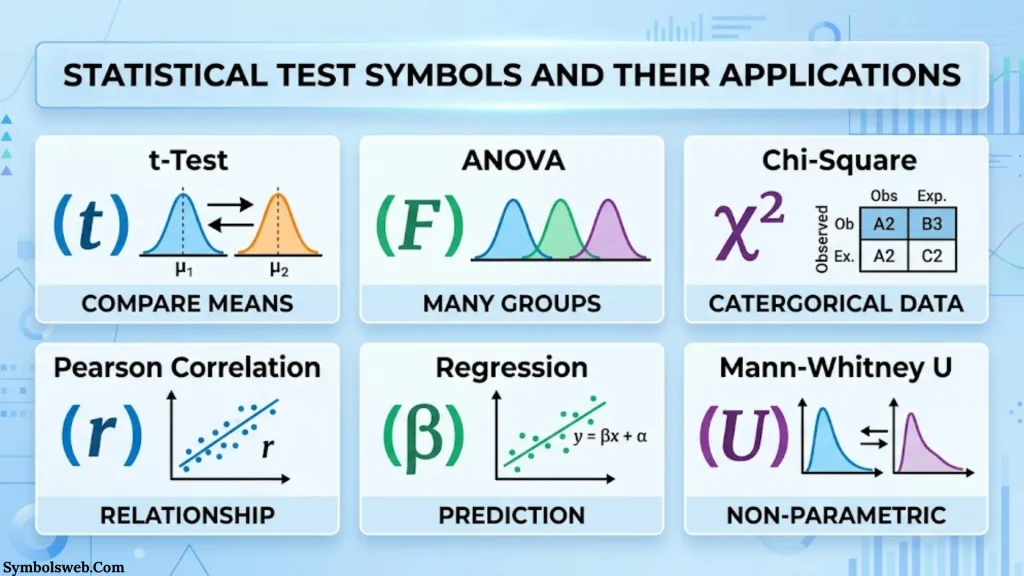
Different statistical tests use different distributions and test statistics. Recognizing their notation helps you understand research findings.
T-Test Symbol: t
The t-statistic commonly appears when researchers test population means using estimated standard errors.
For a one-sample t-test:
[
t=\frac{\bar{x}-\mu_0}{s/\sqrt{n}}
]
The formula compares the sample mean with a hypothesized population mean.
Common t-tests include:
- One-sample t-test.
- Independent two-sample t-test.
- Paired-samples t-test.
Z-Test Symbol: z
The z-statistic represents a standardized value measured in standard error units.
For a one-sample mean test with a known population standard deviation:
[
z=\frac{\bar{x}-\mu_0}{\sigma/\sqrt{n}}
]
Z-tests also appear in tests involving proportions.
The choice between a t-test and a z-test depends on the model, available information, and assumptions. It isn’t determined by sample size alone.
Chi-Square Symbol: χ²
The symbol χ² (chi-square) represents a statistic associated with the chi-square distribution.
A common chi-square test statistic is:
[
\chi^2=\sum\frac{(O-E)^2}{E}
]
Here:
- O = Observed frequency.
- E = Expected frequency.
- Σ = Summation.
Common applications include:
- Chi-square goodness-of-fit tests.
- Chi-square tests of independence.
- Tests involving categorical frequency data.
F-Statistic Symbol: F
The F-statistic represents a ratio of variance estimates or mean squares.
In a one-way ANOVA:
[
F=\frac{MSB}{MSW}
]
Where:
- MSB = Mean square between groups.
- MSW = Mean square within groups.
A larger F-statistic can indicate that group differences are large relative to variation within groups. Its interpretation also depends on degrees of freedom and the model assumptions.
ANOVA Symbols
Analysis of Variance (ANOVA) compares group means using variation within and between groups.
| Symbol | Meaning |
| ANOVA | Analysis of Variance |
| SS | Sum of Squares |
| SSB | Sum of Squares Between Groups |
| SSW | Sum of Squares Within Groups |
| SST | Total Sum of Squares |
| MS | Mean Square |
| MSB | Mean Square Between Groups |
| MSW | Mean Square Within Groups |
| F | F-statistic |
| df | Degrees of freedom |
Different textbooks may use different abbreviations for sums of squares. Always check the definitions provided with a particular analysis.
Correlation Symbols and Their Meanings
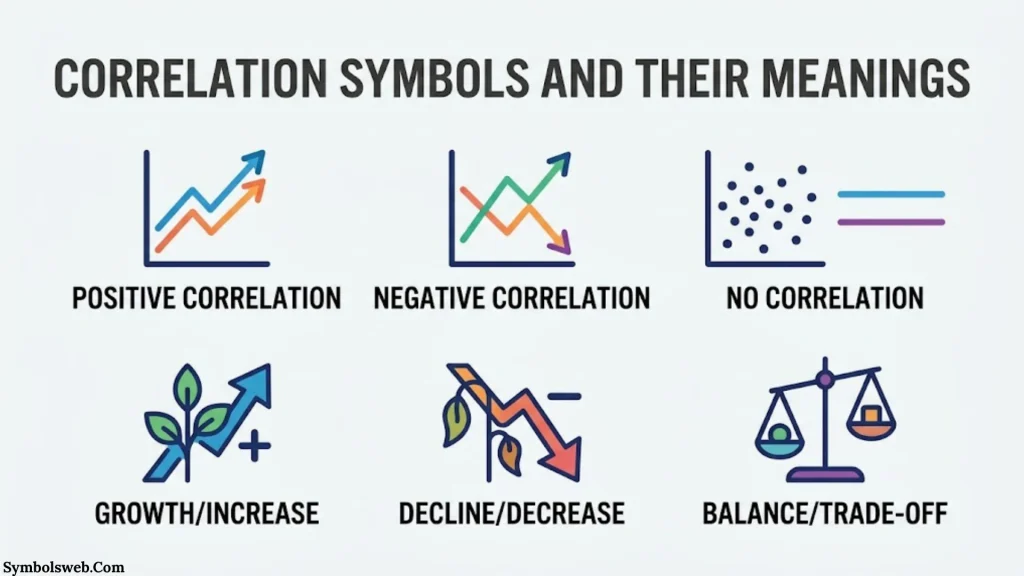
Correlation analysis measures the direction and strength of relationships between variables.
Pearson Correlation Coefficient: r
The symbol r represents the sample Pearson correlation coefficient.
Its value ranges from −1 to +1.
| Correlation value | Interpretation |
| +1 | Perfect positive linear correlation |
| +0.8 | Strong positive linear association |
| +0.3 | Positive linear association |
| 0 | No linear correlation |
| −0.3 | Negative linear association |
| −0.8 | Strong negative linear association |
| −1 | Perfect negative linear correlation |
These strength descriptions are general guides. Their usefulness depends on the research field and data.
Pearson correlation measures linear association. A value near zero doesn’t rule out a strong nonlinear relationship.
Population Correlation Coefficient: ρ
The Greek letter rho (ρ) represents the population correlation coefficient.
The distinction is simple:
- r describes the sample correlation.
- ρ describes the population correlation.
Researchers calculate r from sample observations to estimate the unknown population correlation ρ.
Spearman’s Rank Correlation: ρₛ
Spearman’s rank correlation coefficient measures the strength and direction of a monotonic relationship using ranked observations.
It’s useful when data contain rankings or when a relationship isn’t well described by a straight line.
Some sources use rₛ instead of ρₛ.
Coefficient of Determination: R²
R-squared (R²) measures the proportion of variation in an outcome explained by a regression model under the relevant definition.
For example, an R² of 0.70 indicates that the model explains 70% of the observed variation in the response within the analyzed dataset.
R² doesn’t prove causation or guarantee accurate predictions on new data.
Correlation and Related Statistical Notation
| Symbol | Meaning |
| Cov(X, Y) | Covariance between X and Y |
| sₓᵧ | Sample covariance |
| ρ | Population correlation |
| r | Sample Pearson correlation |
| ρₛ | Spearman rank correlation |
| R² | Coefficient of determination |
Covariance describes how two variables vary together. Correlation standardizes that relationship to a common scale.
Regression Symbols and Their Meanings
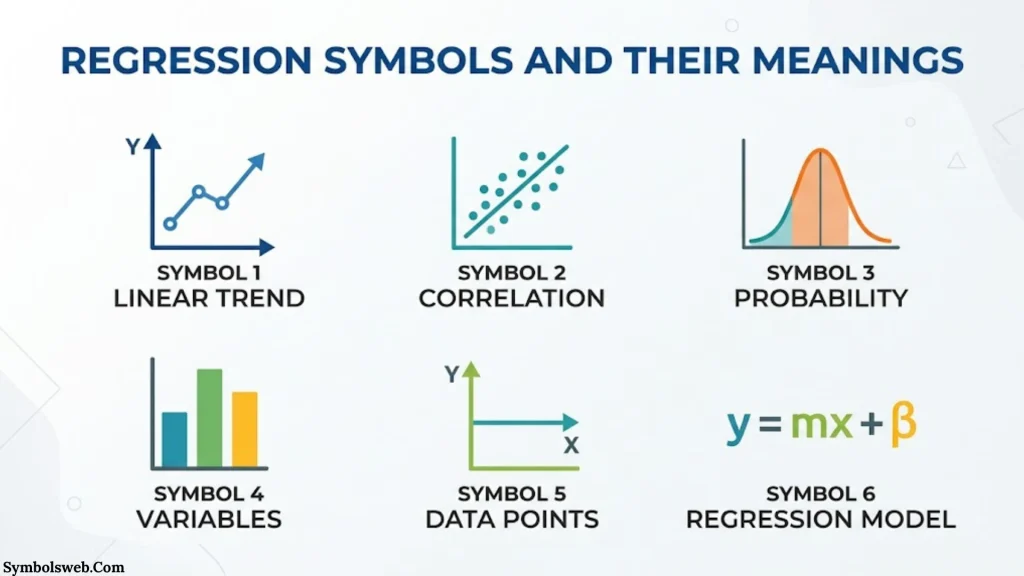
Regression analysis examines relationships between variables and helps estimate or predict an outcome.
Simple Linear Regression Equation
A simple linear regression model describes the relationship between one predictor and one response variable.
The population regression model is:
[
Y=\beta_0+\beta_1X+\varepsilon
]
The estimated sample regression equation is:
[
\hat{y}=b_0+b_1x
]
The symbols represent:
- Y = Response variable.
- X = Predictor variable.
- β₀ = Population intercept.
- β₁ = Population slope.
- ε = Random error term.
- ŷ = Predicted response.
- b₀ = Estimated intercept.
- b₁ = Estimated slope.
Regression Intercept Symbols: β₀ and b₀
The intercept represents the model’s predicted response when the predictor equals zero.
- β₀ represents the population regression intercept.
- b₀ represents its estimated sample value.
For example, a regression equation might predict monthly electricity costs from household energy consumption. The intercept represents the model’s predicted cost at zero consumption, although that interpretation may not be practically meaningful.
Regression Slope Symbols: β₁ and b₁
The slope describes the expected change in the predicted response for a one-unit increase in the predictor.
For example:
[
\hat{y}=20+3x
]
The slope is 3. The model predicts a three-unit increase in y for each additional unit of x.
Predicted Value Symbol: ŷ
The symbol ŷ (y-hat) represents a predicted or fitted response value.
If:
[
\hat{y}=20+3(5)
]
Then:
[
\hat{y}=35
]
The predicted response is 35.
The actual observed value may differ from this prediction.
Random Error Term: ε
The symbol epsilon (ε) represents the random error term in a population regression model.
It accounts for variation in the response that the model’s predictors don’t explain.
For example, household electricity consumption may depend on home size and weather. However, appliance use and individual habits can create additional variation.
Residual Symbol: eᵢ
A residual measures the difference between an observed value and its fitted value.
[
e_i=y_i-\hat{y}_i
]
Where:
- yᵢ = Actual observed value.
- ŷᵢ = Predicted value.
- eᵢ = Residual for observation i.
The distinction between ε and eᵢ matters. Epsilon represents unobserved population error while a residual is calculated from observed sample data.
Multiple Linear Regression Symbols
Multiple regression includes two or more predictor variables.
A population model can be written as:
[
Y=\beta_0+\beta_1X_1+\beta_2X_2+\cdots+\beta_kX_k+\varepsilon
]
Here:
- X₁, X₂, and Xₖ = Predictor variables.
- β₀ = Intercept.
- β₁ through βₖ = Population regression coefficients.
- ε = Random error term.
- k = Number of predictors.
Each regression coefficient describes the expected change in the response for a one-unit predictor increase while holding other predictors constant.
Regression Model Evaluation Symbols
| Symbol | Meaning |
| R² | Coefficient of determination |
| Adjusted R² | R-squared adjusted for model complexity |
| SSE | Sum of squared errors or residuals |
| SSR | Regression sum of squares in a common ANOVA convention |
| SST | Total sum of squares |
| RMSE | Root mean square error |
| eᵢ | Individual residual |
Be careful with SS abbreviations. Some textbooks use SSR for residual sum of squares rather than regression sum of squares.
Greek Letters Used in Statistics
Greek letters appear throughout statistical notation. They represent population parameters, error probabilities, model coefficients, and mathematical operators.
Lowercase Greek Letters in Statistics
| Symbol | Name | Common statistical meaning |
| α | Alpha | Significance level |
| β | Beta | Type II error probability or regression coefficient |
| μ | Mu | Population mean |
| σ | Sigma | Population standard deviation |
| ρ | Rho | Population correlation |
| χ | Chi | Letter used in chi-square notation |
| ε | Epsilon | Random error term |
| λ | Lambda | Rate parameter in some distributions |
| θ | Theta | General model parameter |
| π | Pi | Mathematical constant or population proportion in some contexts |
| τ | Tau | Kendall’s rank correlation coefficient |
| δ | Delta | Difference or effect parameter |
Uppercase Greek Letters in Statistics
| Symbol | Name | Meaning |
| Σ | Capital sigma | Summation operator |
| Δ | Capital delta | Change or difference |
| Π | Capital pi | Product operator |
How Greek Letters Represent Statistical Parameters
Greek letters often identify quantities associated with a population or statistical model.
For example:
- μ describes a population mean.
- σ describes a population standard deviation.
- ρ describes population correlation.
- β₀ and β₁ describe population regression coefficients.
- α describes a significance level.
- θ can represent a general unknown parameter.
However, Greek letters don’t always have one fixed statistical meaning. The surrounding formula determines their interpretation.
Latin Letters Used in Statistics
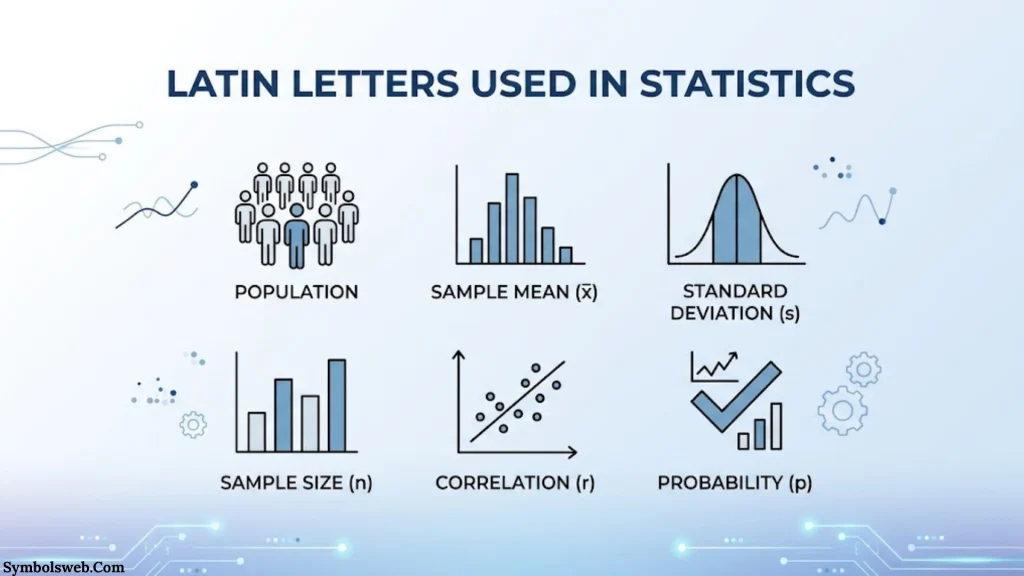
Latin letters also play an important role in statistical notation. They commonly represent variables, sample measurements, estimators, and test statistics.
Lowercase Latin Statistical Symbols
| Symbol | Name | Common meaning |
| x | X | Observed value or variable |
| y | Y | Response variable or observed value |
| n | N | Sample size |
| s | S | Sample standard deviation |
| r | R | Sample correlation |
| p | P | P-value or probability, depending on context |
| t | T | T statistic |
| z | Z | Z-statistic |
| b | B | Estimated regression coefficient |
| e | E | Residual |
Uppercase Latin Statistical Symbols
| Symbol | Name | Common meaning |
| N | N | Population size |
| X | X | Random variable |
| Y | Y | Response or random variable |
| F | F | F-statistic |
| R² | R-squared | Coefficient of determination |
| E | E | Expected value operator |
| M | M | Median in some reporting conventions |
Subscripts, Superscripts, and Modified Latin Letters
Small marks around statistical letters can change their meaning.
Examples include:
- xᵢ: Individual observation.
- x̄: Sample mean.
- ŷ: Predicted response.
- x₁ and x₂: Indexed variables.
- b₀: Estimated intercept.
- b₁: Estimated slope.
- Xᵀ: Transpose of matrix X.
- X⁻¹: Inverse of matrix X.
- X²: Squared value of X.
Subscripts identify variables or observations. Superscripts commonly indicate powers, transformations, or other mathematical relationships.
Mathematical Operators and Special Symbols in Statistics
Statistical formulas also use common mathematical operators. Understanding these marks makes complex equations easier to follow.
Summation and Product Symbols
| Symbol | Name | Meaning |
| Σ | Summation | Add a sequence of values |
| Π | Product | Multiply a sequence of values |
For example, Σ adds observations while Π multiplies them.
Comparison Symbols in Statistics
| Symbol | Meaning |
| = | Equal to |
| ≠ | Not equal to |
| < | Less than |
| > | Greater than |
| ≤ | Less than or equal to |
| ≥ | Greater than or equal to |
| ≈ | Approximately equal to |
| ∝ | Proportional to |
These symbols appear in hypotheses, probability statements, and mathematical equations.
Set and Probability Operators
| Symbol | Name | Meaning |
| ∈ | Element of | Belongs to a set |
| ∉ | Not an element of | Doesn’t belong to a set |
| ∩ | Intersection | Shared outcomes |
| ∪ | Union | Outcomes in either event |
| ∅ | Empty set | Set with no elements |
| | | Conditional bar | Given that |
| ∀ | For all | Applies to every member |
| ∃ | There exists | At least one member exists |
Mathematical Notation in Statistical Formulas
| Symbol | Meaning |
| √ | Square root |
| ∞ | Infinity |
| ± | Plus or minus |
| ! | Factorial |
| |x| | Absolute value |
| x² | Squared value |
| xⁿ | Exponentiation |
| log(x) | Logarithm |
| ln(x) | Natural logarithm |
Calculus and Advanced Statistical Notation
Advanced statistical methods use calculus and optimization symbols.
- ∂: Partial derivative.
- d/dx: Derivative with respect to x.
- ∇: Gradient operator.
- ∫: Integral.
- lim: Limit.
- argmax: Value that maximizes a function.
- argmin: Value that minimizes a function.
These symbols commonly appear in probability theory, likelihood estimation, statistical modeling, and machine learning.
Statistical Formulas and Their Symbols Explained
Statistical formulas combine variables, operators, and parameters to describe mathematical relationships. Learning the symbols alongside their formulas makes calculations easier to understand.
Descriptive Statistics Formulas
| Calculation | Formula |
| Population mean | μ = Σxᵢ / N |
| Sample mean | x̄ = Σxᵢ / n |
| Population variance | σ² = Σ(xᵢ − μ)² / N |
| Sample variance | s² = Σ(xᵢ − x̄)² / (n − 1) |
| Population standard deviation | σ = √σ² |
| Sample standard deviation | s = √s² |
| Interquartile range | IQR = Q3 − Q1 |
| Population CV | CV = (σ / μ) × 100% |
| Sample CV | CV = (s / x̄) × 100% |
| Standard error of mean | SE = s / √n |
Probability Formulas
| Rule | Formula |
| Basic probability | P(A) = Favorable outcomes / Total outcomes |
| Addition rule | P(A ∪ B) = P(A) + P(B) − P(A ∩ B) |
| Conditional probability | P(A | B) = P(A ∩ B) / P(B) |
| Complement rule | P(Aᶜ) = 1 − P(A) |
| Independent events | P(A ∩ B) = P(A)P(B) |
| Expected value | E(X) = ΣxP(X = x) |
Hypothesis Testing Formulas
| Calculation | Formula |
| One-sample t-statistic | t = (x̄ − μ₀) / (s / √n) |
| One-sample z-statistic | z = (x̄ − μ₀) / (σ / √n) |
| Statistical power | 1 − β |
| Sample variance degrees of freedom | df = n − 1 |
| General confidence interval | Estimate ± Critical value × SE |
Correlation and Regression Formulas
Pearson correlation coefficient:
[
r=\frac{\sum(x_i-\bar{x})(y_i-\bar{y})}{\sqrt{\sum(x_i-\bar{x})^2\sum(y_i-\bar{y})^2}}
]
Simple linear regression:
[
\hat{y}=b_0+b_1x
]
Regression slope:
[
b_1=\frac{\sum(x_i-\bar{x})(y_i-\bar{y})}{\sum(x_i-\bar{x})^2}
]
Regression intercept:
[
b_0=\bar{y}-b_1\bar{x}
]
Residual:
[
e_i=y_i-\hat{y}_i
]
These formulas provide a useful foundation for interpreting statistical calculations and research findings.
Common Statistics Symbols That Students Often Confuse
Some statistical symbols look similar but represent different concepts. Understanding their differences prevents mistakes in calculations and research interpretation.
| Symbol comparison | First meaning | Second meaning |
| μ vs. x̄ | Population mean | Sample mean |
| σ vs. s | Population standard deviation | Sample standard deviation |
| σ² vs. s² | Population variance | Sample variance |
| Σ vs. σ | Summation | Population standard deviation |
| N vs. n | Population size | Sample size |
| α vs. p | Significance level | P-value |
| α vs. β | Type I error probability | Type II error probability |
| r vs. ρ | Sample correlation | Population correlation |
| R² vs. r | Coefficient of determination | Correlation coefficient |
| β vs. β₁ | Context-dependent parameter or error probability | Population regression slope |
| ε vs. eᵢ | Random error | Sample residual |
| ∪ vs. ∩ | Union | Intersection |
μ vs. x̄: Population Mean vs. Sample Mean
The symbol μ represents the average of an entire population. The symbol x̄ represents the average calculated from a sample.
For example, the average height of all students at a university is μ. The average height of 200 selected students is x̄.
σ vs. s: Population vs. Sample Standard Deviation
Both symbols measure data spread. However, σ describes the population while s describes the sample.
The distinction also affects their variance formulas and denominators.
Σ vs. σ: Summation vs. Standard Deviation
Uppercase sigma (Σ) instructs you to add values. Lowercase sigma (σ) represents population standard deviation.
Their similar appearance makes this one of the most common notation mistakes.
α vs. p: Significance Level vs. P-Value
Alpha is generally selected before testing. The p-value is calculated from the observed data under the null model.
Researchers compare the two to make a statistical decision.
r vs. ρ: Sample vs. Population Correlation
The sample correlation r estimates the population correlation ρ. They describe related quantities but aren’t interchangeable.
ε vs. eᵢ: Random Error vs. Residual
The random error term belongs to the population regression model. A residual comes from comparing an observed sample value with its fitted prediction.
How to Read and Interpret Statistical Symbols
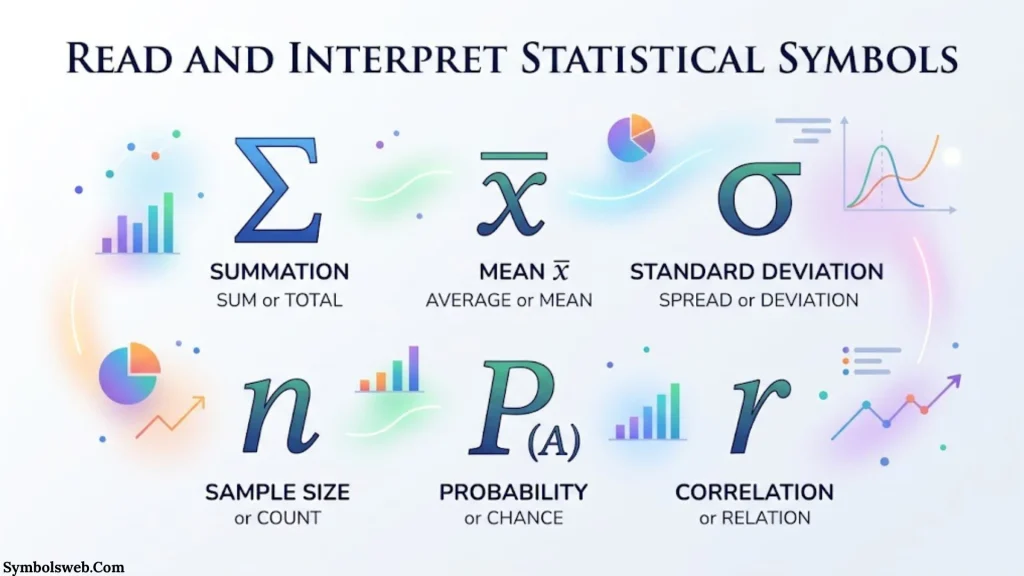
Statistical notation becomes easier when you break formulas into smaller parts. Instead of trying to understand an entire equation immediately, identify each component first.
How to Read Greek and Latin Letters
Start by identifying the letter and its context.
For example:
- μ usually represents population mean.
- x̄ usually represents a sample mean.
- σ usually represents population standard deviation.
- r usually represents sample correlation.
- β₁ usually represents a population regression slope.
Then examine the surrounding formula to confirm its meaning.
How to Understand Subscripts and Superscripts
A subscript usually identifies an observation, variable, or group.
For example, x₁ and x₂ represent two indexed values.
A superscript may represent an exponent. In σ², the superscript 2 indicates variance as the square of standard deviation.
A bar or hat also changes notation:
- x̄ means sample mean.
- ŷ means predicted response.
- p̂ commonly means estimated sample proportion.
How to Interpret Statistical Equations
Consider this equation:
[
\bar{x}=\frac{\sum x_i}{n}
]
Read it as: The sample mean equals the sum of all sample observations divided by the sample size.
Break it into three parts:
- Identify x̄ as the sample mean.
- Identify Σxᵢ as the sum of observations.
- Identify n as the number of observations.
This approach works for descriptive statistics, probability, and regression formulas.
How to Read Statistical Symbols in Research Papers
Research papers frequently report means, standard deviations, test statistics, and p-values.
For example:
[
t(28)=2.45,\quad p=.021
]
This result reports a t-statistic of 2.45 with 28 degrees of freedom and a p-value of .021.
When the significance threshold is .05, the result is statistically significant under the stated testing procedure.
However, statistical significance doesn’t automatically establish practical importance. Effect sizes and confidence intervals provide additional information.
Statistics Symbols in Research Papers and Academic Writing
Researchers use statistical notation to present results clearly and consistently. These conventions appear in psychology, medicine, education, economics, engineering, and other academic fields.
Statistical Symbols in Research Reports
Commonly reported quantities include:
- Sample size (n).
- Mean (M or x̄).
- Standard deviation (SD or s).
- Standard error (SE).
- Test statistic (t, z, χ², or F).
- Degrees of freedom (df).
- P-value (p).
- Confidence interval (CI).
- Correlation coefficient (r).
Statistical Notation in APA-Style Writing
The American Psychological Association provides formatting conventions for statistical information.
Common APA-style practices include:
- Italicize statistical variables and test symbols where required.
- Use standard type for Greek letters.
- Report degrees of freedom in parentheses.
- Present confidence interval limits in square brackets.
- Use consistent statistical notation throughout a manuscript.
- Explain abbreviations when readers might not recognize them.
For example:
[
t(45)=4.35
]
This notation identifies the t-statistic and its degrees of freedom.
The exact formatting should follow the applicable edition of the APA Publication Manual or the journal’s own requirements.
Common Statistical Reporting Mistakes
Avoid these mistakes when interpreting or presenting research results:
- Confusing a p-value with the probability that the null hypothesis is true.
- Treating statistical significance as proof of practical importance.
- Reporting correlation as evidence of causation.
- Confusing standard error with standard deviation.
- Mixing population parameters with sample statistics.
- Reporting a confidence interval without explaining its interpretation.
- Using different symbols for the same quantity without defining them.
For further guidance, consult the Purdue OWL statistics and APA guide.
Real World Examples of Statistics Symbols

Statistical notation becomes more useful when connected to familiar situations. The following examples show how these symbols support real data analysis.
Statistics Symbols in Student Exam Results
Imagine a class has 40 students. A teacher selects 10 students to examine their exam performance.
The sample size is:
[
n=10
]
Suppose their average score is 82.
[
\bar{x}=82
]
If the teacher calculates a sample standard deviation of 6, the notation becomes:
[
s=6
]
These measurements summarize the selected students. They can also help estimate the performance of the entire class.
Statistics Symbols in Sports Analytics
Sports analysts use statistical notation to compare athletes and examine performance patterns.
For example, a basketball analyst might study the relationship between practice hours and shooting accuracy.
- X = Weekly practice hours.
- Y = Shooting accuracy.
- r = Sample correlation coefficient.
- R² = Explained variation in a fitted regression model.
- ŷ = Predicted shooting accuracy.
If the correlation is positive, players who practice more tend to have higher shooting accuracy in the observed data. However, correlation alone doesn’t prove that additional practice caused the improvement.
Statistics Symbols in Manufacturing Quality Control
Factories use statistical methods to monitor product dimensions and manufacturing consistency.
Suppose a factory produces metal bolts with a target diameter of 10 millimeters.
A quality inspector selects 50 bolts:
[
n=50
]
The sample mean is 10.02 millimeters. The sample standard deviation is 0.05 millimeters.
These measurements help assess whether production remains consistent with the required specifications.
Statistical process control also uses control charts and process variation measures to identify unusual changes.
Statistics Symbols in Medical Research
Medical researchers use descriptive and inferential statistics to study health measurements.
For example, a study might measure the resting heart rate of 100 adult participants.
- n = 100 participants.
- x̄ = Average resting heart rate.
- s = Sample standard deviation.
- SE = Standard error of the sample mean.
- CI = Confidence interval.
Researchers can use these measurements to summarize participants and estimate population characteristics.
Statistics Symbols in Weather and Probability
Weather forecasting uses probability to communicate uncertainty.
Suppose a forecast assigns a 30% probability of rain.
[
P(\text{Rain})=0.30
]
The complement represents the probability of no rain:
[
P(\text{No rain})=1-0.30=0.70
]
Therefore, the probability of no rain is 70% under the same forecast definition and time period.
Probability notation helps communicate uncertainty without presenting predictions as guarantees.
Frequently Asked Questions About Statistics Symbols
What Are the Most Common Symbols Used in Statistics?
The most common statistics symbols include μ for population mean, x̄ for sample mean, σ for population standard deviations, s for sample standard deviation, and n for sample size. Other frequently used symbols include Σ, α, β, p, r, ρ, and R².
What Does μ Mean in Statistics?
The Greek letter μ (mu) represents the population mean. It describes the arithmetic average of every observation in a defined population. Researchers often estimate μ using the sample mean x̄.
What Is the Difference Between μ and x̄?
The symbol μ represents a population mean while x̄ represents a sample mean. For example, μ describes the average score of every student in a school. The symbol x̄ describes the average score of a selected group of students.
What Does σ Represent in Statistics?
The Greek letter σ (sigma) represents population standard deviation. It measures how widely population observations spread around their mean. A larger σ indicates greater variability.
What Is the Difference Between σ and s?
Sigma (σ) represents population standard deviation while s represents sample standard deviation. The population formula divides squared deviations by N. The sample formula commonly divided by n − 1.
What Does σ² Mean in Statistics?
The symbol σ² represents population variance. It measures the average squared deviation of population observations from their mean. Taking its square root gives the population standard deviation σ.
What Does Uppercase Sigma (Σ) Mean in Statistics?
Uppercase sigma (Σ) represents the summation operator. It tells you to add a sequence of values. For example, Σxᵢ represents the sum of indexed observations.
What Do n and N Represent in Statistics?
Uppercase N usually represents population size. Lowercase n usually represents sample size. For example, a population might contain 5,000 people while a selected sample contains 200.
What Does IQR Mean in Statistics?
IQR stands for interquartile range. It measures the spread of the middle 50% of ordered observations. Its formula is Q3 − Q1.
What Does Alpha (α) Mean in Statistics?
Alpha represents the significance level in hypothesis testing. It commonly uses values such as 0.05 or 0.01. Under the testing procedure, it sets the Type I error probability.
What Does Beta (β) Mean in Statistics?
Beta can represent the probability of a Type II error in hypothesis testing. It can also represent a population regression coefficient. Its meaning depends on the statistical model and context.
What Does H₀ Mean in Hypothesis Testing?
H₀ represents the null hypothesis. It states the baseline claim being evaluated using sample evidence. A statistical test determines whether the evidence justifies rejecting that claim.
What Is the Difference Between Alpha and P-Value?
Alpha is the significance threshold selected before a statistical test. The p-value is calculated from the observed data under the null hypothesis. Researchers compare the p-value with alpha when making a testing decision.
What Does P(A | B) Meaning in Probability?
P(A | B) represents the conditional probability of event A occurring given that event B has occurred. It measures the likelihood of A under the condition that B is known.
What Is the Difference Between Union (∪) and Intersection (∩)?
Union (∪) represents outcomes belonging to event A, event B, or both. Intersection (∩) represents outcomes shared by both events. In probability, union means inclusive OR while intersection means AND.
What Does R² Mean in Regression?
R² represents the coefficient of determination. It measures the proportion of variation in the response explained by a regression model under the relevant definition. An R² of 0.80 indicates 80% explained variation in the analyzed data.
What Is the Difference Between r and ρ?
The symbol r commonly represents the sample Pearson correlation coefficient. The Greek letter ρ represents population correlation. Researchers use sample correlation to estimate the population relationship.
What Does Epsilon (ε) Mean in Regression?
Epsilon represents the random error term in a population regression model. It accounts for variation that the included predictors don’t explain. It differs from a sample residual calculated using observed and predicted values.
What Is the Difference Between a T-Statistic and a Z-Statistic?
A t-statistic commonly uses the Student’s t-distribution when estimating a standard error from sample data. A z-statistic uses the standard normal distribution under its applicable assumptions. The appropriate test depends on the statistical model and available information.
Why Do Statistics Use Greek Letters?
Greek letters provide convenient notation for population parameters and other statistical quantities. For example, μ represents population mean, σ represents population standard deviation, and ρ represents population correlation. Their meanings depend on the surrounding statistical context.
How Do You Read Statistical Formulas?
Start by identifying the variables, operators, subscripts, and parameters. Then examine how these components relate to one another. Breaking a formula into smaller parts makes even complicated statistical expressions easier to understand.
Conclusion: Understanding Statistics Symbols and Notation
Statistics symbols provide a shared mathematical language for describing data, probability, and research findings. From μ and x̄ to α, β, r, and R², each symbol represents a specific quantity or operation within its statistical context. Learning these meanings helps you understand calculations and interpret statistical results accurately.
Start with descriptive statistics symbols such as mean, median, variance, and standard deviation. Then explore probability notation, hypothesis testing, correlation, and regression. Pay particular attention to similar looking symbols because small differences can change an entire calculation. A clear understanding of population parameters and sample statistics also makes statistical formulas much easier to follow.
Keep these statistics symbols cheat sheets nearby when studying mathematics or reviewing research papers. Use the comparison tables to check unfamiliar notation and refer to the formulas when solving problems. With regular practice, statistical symbols become less intimidating and much easier to recognize.

Hi, I’m Ethan Holloway, and I’ve always believed that a few meaningful words can change the way we think, feel, and live. I enjoy collecting timeless quotes, studying their deeper meanings, and sharing inspiring messages that help people stay motivated through every stage of life.
Over the years, I’ve explored thousands of famous sayings from writers, leaders, philosophers, and everyday people. My goal is to make wisdom easy to understand and useful for everyone.
Books by Ethan Holloway
- The Power of Everyday Quotes
- Words That Inspire Greatness
 Jordan Hayes