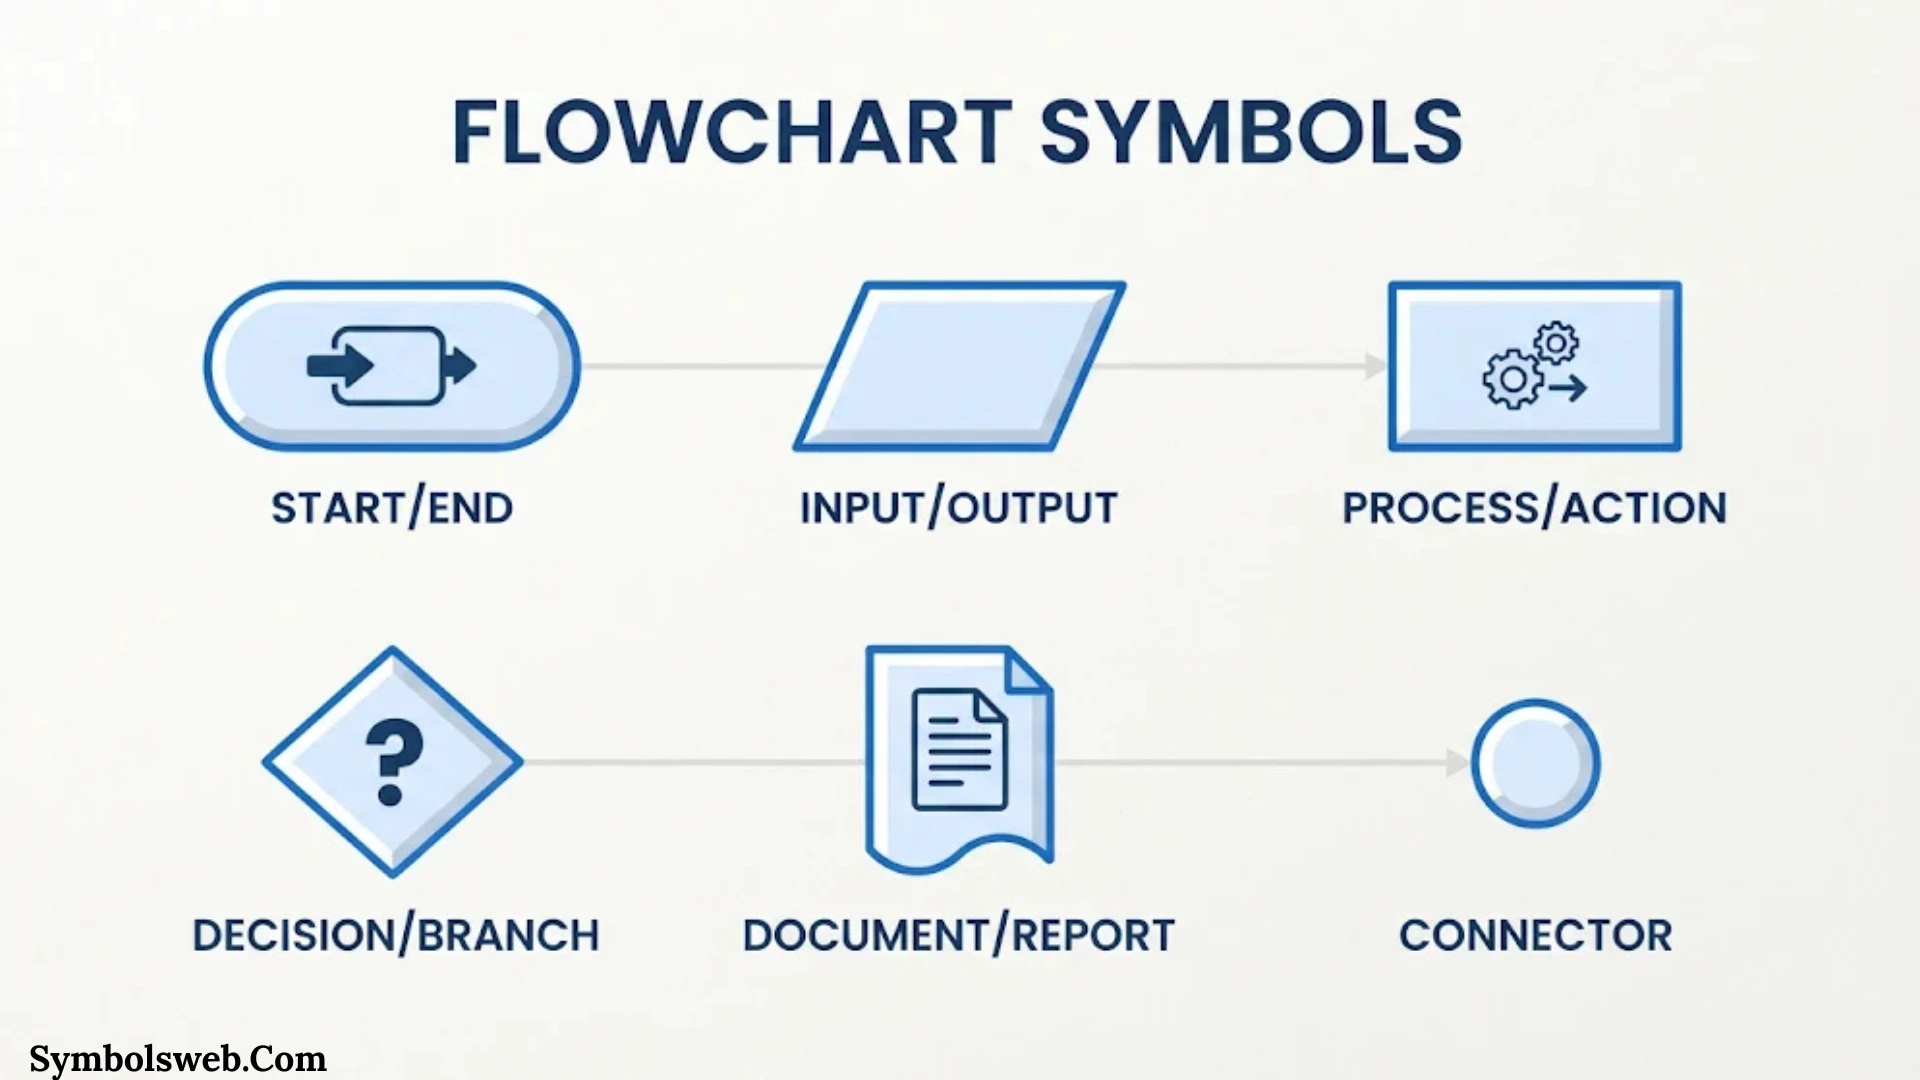
Flowcharts turn complicated processes into simple visual steps. They help you understand how information moves, where decisions happen, and what comes next. Whether you’re planning a business process, explaining an algorithm, or documenting a computer system, the right flowchart symbols make your diagram easier to understand.
Each shape has a specific purpose. A rectangle usually represents a process, a diamond shows a decision, and an oval marks the beginning or end. Arrows connect these shapes and show the direction of the workflow.
However, flowcharts include more than these familiar symbols. Standard diagrams can also use shapes for documents, databases, manual operations, data storage, delays, and specialized processing steps.
This guide explains the most common flowchart symbols and their meanings, how to use them, and when to choose less familiar shapes. You’ll also find quick-reference tables and practical examples to help you create clear, accurate diagrams.
What Are Flowchart Symbols?
Flowchart symbols are standardized shapes that represent different actions, decisions, inputs, outputs, and connections in a process. Each symbol communicates a particular type of activity. This allows readers to understand a workflow without reading lengthy explanations.
A flowchart combines these symbols with arrows and short descriptions. Together, they show how a process starts, what happens during each step, and how it finishes.
For example, imagine a customer placing an online order:
- The customer opens an online store.
- The customer selects a product.
- The system checks whether the product is available.
- The customer enters payment details.
- The system approves or rejects the payment.
- The order is confirmed or canceled.
A flowchart represents each activity with an appropriate shape. It uses arrows to connect the steps and decision branches to show different outcomes.
Why Do Flowchart Symbols Matter?
Using the correct symbols makes a diagram easier to read and understand. It also helps different people interpret the same process consistently.
Flowchart symbols offer several benefits:
- Improve communication: Teams can understand a process without lengthy explanations.
- Show decision points: Diamonds make yes-or-no choices easy to identify.
- Reveal problems: A visual workflow can expose unnecessary steps, delays, and repeated tasks.
- Support documentation: Businesses can record procedures in a consistent format.
- Simplify complex systems: Large processes become easier to divide into smaller sections.
- Help with programming: Developers can map algorithms before writing code.
- Support employee training: New team members can follow visual instructions more easily.
A well-designed flowchart does more than explain what happens. It shows how each activity connects to the next.
Basic Flowchart Symbols and Their Meanings
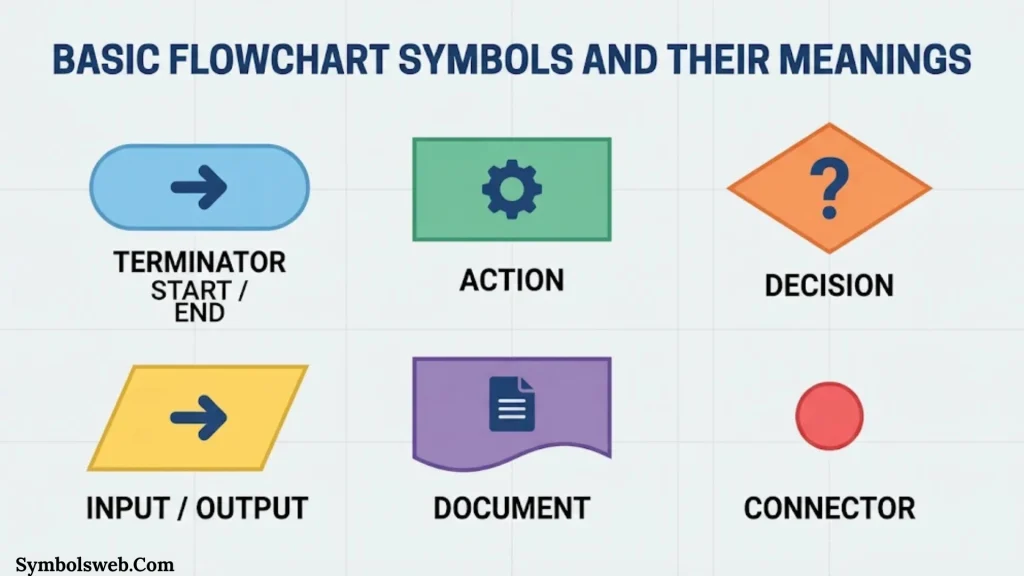
Most everyday flowcharts use a small group of standard shapes. You can create many useful diagrams with these basic symbols.
Terminator Symbol: Start and End
The terminator symbol represents the beginning or ending point of a process. It usually appears as an oval or a rounded rectangle.
You may see labels such as:
- Start
- Begin
- End
- Finish
- Stop
Every simple flowchart should have a clear starting point. It should also show where the process ends.
For example, a password-reset flowchart might begin with “Start” and finish with “Password updated” or “Request canceled.”
When to use it: Use a terminator at the beginning and end of a workflow. Avoid using it for ordinary actions that happen during the process.
Process Symbol: An Action or Operation
The process symbol is a rectangle. It represents an action, task, instruction, or operation performed during a workflow.
Common process labels include:
- Calculate total
- Verify account
- Print invoice
- Update customer record
- Send confirmation email
- Save changes
For example, a payroll flowchart may include a process box labeled “Calculate employee salary.” Another rectangle might show “Deduct taxes.”
Each process box should describe one clear activity. If a rectangle contains several unrelated tasks, consider splitting it into smaller steps.
When to use it: Use a process symbol whenever someone or something performs an action.
Decision Symbol: A Question or Choice
The decision symbol is a diamond. It represents a question or condition that determines which path the process follows.
A decision usually creates two or more branches. Each branch should have a clear label.
For example:
Is the payment approved?
- Yes: Confirm the order.
- No: Display a payment error.
Other common decision questions include:
- Is the customer eligible?
- Is the password correct?
- Is the item in stock?
- Has the deadline passed?
A decision symbol should contain a short, direct question. Its outgoing arrows should identify the possible answers.
When to use it: Use a diamond when a condition changes the direction of a process.
Input/Output Symbol: Data Entering or Leaving a System
The input/output symbol is a parallelogram. It represents information entering or leaving a process.
Examples include:
- Enter customer name
- Receive payment details
- Display account balance
- Print sales report
- Submit registration form
- Export transaction data
Consider an online registration process. The user enters an email address, which represents input. The system then displays a confirmation message, which represents output.
Both actions use the input/output symbol because they involve information moving into or out of the system.
When to use it: Use this symbol for data entry, displayed information, printed results, and similar input or output activities.
Flowline Symbol: Direction of Movement
A flowline is an arrow that connects flowchart symbols. It shows the order in which steps occur.
Flowlines help readers understand the sequence of a process. They can point downward, upward, left, or right depending on the diagram’s layout.
For example:
Start → Enter Details → Verify Information → Display Result → End
A flowline should connect related steps clearly. Avoid crossing arrows when possible because they can make a diagram confusing.
When to use it: Use flowlines to show the direction of a workflow and connect its symbols.
On Page Connector Symbol
The on page connector symbol is usually a small circle. It connects separated parts of a flowchart on the same page.
A connector is useful when long arrows would clutter a diagram. You can label matching connectors with letters or numbers.
For example, one section may end at connector A. Another section on the same page begins with connector A. The matching labels show that the flow continues between those points.
When to use it: Use an on-page connector when you need to link distant sections without drawing a long or crossing line.
Off Page Connector Symbol
The off page connector shows that a process continues on another page. It commonly looks like a pentagon or home plate shape.
Large flowcharts often need multiple pages. An off-page connector keeps the diagram organized while showing where the workflow continues.
For example, a sales process may finish its first page at connector B. The next page begins with the matching connector and continues with order fulfillment.
You can label the connector with a page number or another reference.
When to use it: Use an off-page connector when a workflow continues on a separate page or diagram.
Predefined Process Symbol: A Subroutine
The predefined process symbol represents a process that has already been defined elsewhere. It is usually a rectangle with two additional vertical lines near its sides.
This symbol is also known as a subroutine symbol or predefined process shape.
For example, an online store may use a predefined process called “Calculate Shipping Cost.” The detailed calculation may appear in a separate flowchart.
Instead of repeating every calculation step, the main diagram references the existing process.
When to use it: Use this symbol when a workflow calls another established procedure or reusable process.
Preparation Symbol: Setup or Initialization
The preparation symbol is a hexagon. It represents a setup activity or initialization step before the main process begins.
Common examples include:
- Initialize variables
- Set system parameters
- Prepare equipment
- Configure application settings
- Establish starting conditions
In a software algorithm, the preparation symbol may represent setting a counter to zero before a loop begins.
When to use it: Use the preparation symbol when a process requires initial setup or configuration.
Manual Input Symbol
The manual input symbol usually appears as a rectangle with a slanted upper edge. It represents information entered manually by a person.
Examples include:
- Enter username
- Type a phone number
- Enter an order quantity
- Submit a form
- Provide a verification code
This symbol is useful when you want to distinguish human data entry from automated system input.
When to use it: Use manual input when a person enters information through a keyboard, form, touchscreen, or another input method.
Manual Operation Symbol
The manual operation symbol is usually a trapezoid. It represents a task performed by a person rather than an automated system.
Examples include:
- Inspect a product
- Sign a document
- Approve a paper form
- Package an order
- Check equipment manually
Manual operation differs from manual input. Manual input focuses on entering data. Manual operation represents a broader human-performed task.
When to use it: Use this symbol when a person must physically perform an activity within the workflow.
Document Symbol
The document symbol represents a document created, received, or used during a process. It usually has a rectangle with a wavy bottom edge.
Examples include:
- Invoice
- Purchase order
- Printed report
- Application form
- Delivery receipt
- Contract
For example, a purchasing workflow may generate an invoice after payment approval.
When to use it: Use the document symbol when a process creates, receives, or relies on a document.
Multiple Documents Symbol
The multiple documents symbol represents two or more documents. It looks similar to the document symbol but includes overlapping document shapes.
For example, a customer onboarding process may generate:
- A welcome letter
- A customer agreement
- An account summary
Instead of drawing three separate document symbols, you can use one multiple-documents symbol when the documents belong to the same step.
When to use it: Use this symbol when an activity produces or processes a group of documents.
Delay Symbol
The delay symbol represents a waiting period or pause in a process. It usually appears as a semicircle or D-shaped symbol.
Examples include:
- Wait for customer response
- Hold order for approval
- Wait for payment confirmation
- Allow system processing time
- Schedule delivery
A delay symbol helps identify where a process may slow down. This is especially useful when analyzing service workflows and production systems.
When to use it: Use a delay symbol when the process must wait before moving forward.
Merge Symbol
The merge symbol shows where two or more process paths come together. It is commonly represented by an inverted triangle in some flowchart conventions.
Imagine a registration process with two possible paths:
- Existing customers verify their accounts.
- New customers create accounts.
Both paths may continue to the same next step: “Open dashboard.”
A merge symbol can represent the point where these paths rejoin. In simpler diagrams, arrows may also join directly when the meaning remains clear.
When to use it: Use a merge symbol when separate branches combine into one flow.
Data Storage Symbol
The data storage symbol represents information stored for later use. Its appearance can vary depending on the notation and type of storage.
Examples include:
- Save customer record
- Store transaction details
- Archive sales information
- Save application settings
- Store product information
Data storage is common in software, database, and information-system diagrams.
When to use it: Use a data storage symbol when information is saved rather than simply passed to the next activity.
Flowchart Symbols Quick Reference Table
The table below summarizes common flowchart shapes and their functions.
| Flowchart symbol | Typical shape | Meaning |
| Terminator | Oval or rounded rectangle | Start or end |
| Process | Rectangle | Action or operation |
| Decision | Diamond | Question or condition |
| Input/Output | Parallelogram | Data entering or leaving |
| Flowline | Arrow | Direction of flow |
| On-page connector | Circle | Connection on the same page |
| Off-page connector | Pentagon | Connection to another page |
| Predefined process | Rectangle with double vertical lines | Subroutine or reusable process |
| Preparation | Hexagon | Setup or initialization |
| Manual input | Slanted-top rectangle | Human data entry |
| Manual operation | Trapezoid | Human-performed task |
| Document | Rectangle with wavy bottom | Document |
| Multiple documents | Overlapping document shapes | Several documents |
| Delay | D-shape or semicircle | Waiting period |
| Merge | Inverted triangle in some conventions | Paths coming together |
| Data storage | Storage-specific shape | Saved information |
These shapes cover many everyday business and technical workflows. Specialized diagrams may use additional symbols.
Advanced Flowchart Symbols and Their Meanings
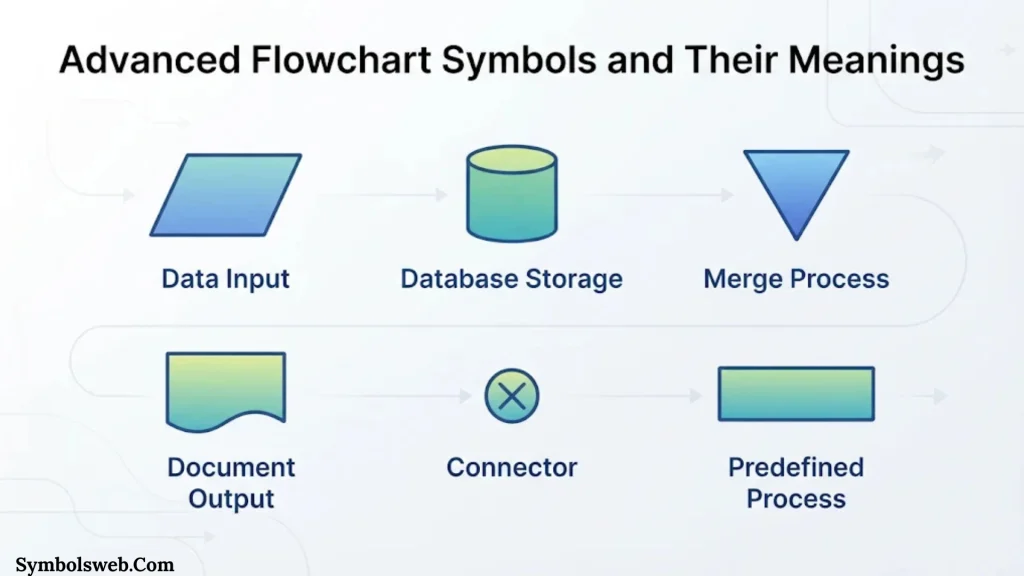
Complex workflows often need more than basic process and decision shapes. Advanced symbols can represent particular types of data handling, system operations, and program logic.
Not every flowchart needs these symbols. Use them when the extra detail helps readers understand the process.
Display Symbol
The display symbol represents information shown on a screen or visual output device. It may appear as a screen-like shape with a curved or angled edge.
Examples include:
- Display login message
- Show search results
- Display account balance
- Show payment status
- Present an error notification
This symbol helps distinguish screen-based output from printed documents.
When to use it: Use a display symbol when the process presents information on a monitor or another visual display.
Internal Storage Symbol
The internal storage symbol represents data held in a computer’s internal memory. It is often drawn as a rectangle with internal storage markings.
Examples include:
- Store a temporary value in memory
- Retrieve a variable
- Hold information during processing
- Read a stored program value
Internal storage differs from long-term data storage. It generally refers to information kept in the system’s memory during execution.
When to use it: Use this symbol when the flowchart needs to show internal memory operations.
Direct Access Storage Symbol
The direct access storage symbol represents information stored on a medium that allows direct access to records or data locations.
Examples include data stored on:
- Hard disk drives
- Solid-state drives
- Direct-access storage systems
Unlike sequential access, direct access does not require reading every earlier record to reach a particular location.
When to use it: Use this symbol in technical diagrams when direct-access storage is important to the process.
Magnetic Tape Symbol
The magnetic tape symbol represents data stored on magnetic tape. It is associated with older computing systems and some modern archival or backup environments.
Magnetic tape stores data in a sequential format. The system generally reads information in order rather than jumping directly to any record.
When to use it: Use this symbol when documenting tape-based storage, archival systems, or legacy data-processing workflows.
Collate Symbol
The collate symbol represents the process of arranging or combining information into a particular sequence.
For example, a document-processing workflow may combine several pages into the correct order before printing.
A data-processing workflow may also collate records from different sources.
When to use it: Use the collate symbol when a process combines or arranges related items into an ordered set.
Sort Symbol
The sort symbol represents arranging data or items according to a specified order.
Examples include:
- Sort customers by last name
- Arrange products by price
- Order transactions by date
- Rank applications by score
Sorting can use ascending or descending order. The label should make the sorting rule clear.
When to use it: Use a sort symbol when a workflow organizes information according to a specific criterion.
Summing Junction Symbol
The summing junction symbol represents a point where multiple inputs are combined or added together. It is often shown as a circle with a plus sign.
For example, a sales calculation may combine the product price, shipping cost, and applicable fees to determine the final amount.
The symbol can be useful in engineering, control systems, and mathematical process diagrams.
When to use it: Use a summing junction when the workflow combines numerical inputs into one result.
OR Symbol
The OR symbol represents a logical OR operation. It indicates that a process can continue when at least one specified condition is satisfied.
For example, a user may verify an account using either an email code or a phone code.
The process can continue if either method succeeds.
When to use it: Use an OR symbol when the logic depends on one or more alternative conditions being true. In many ordinary flowcharts, a clearly labeled decision diamond is sufficient.
Loop Limit Symbol
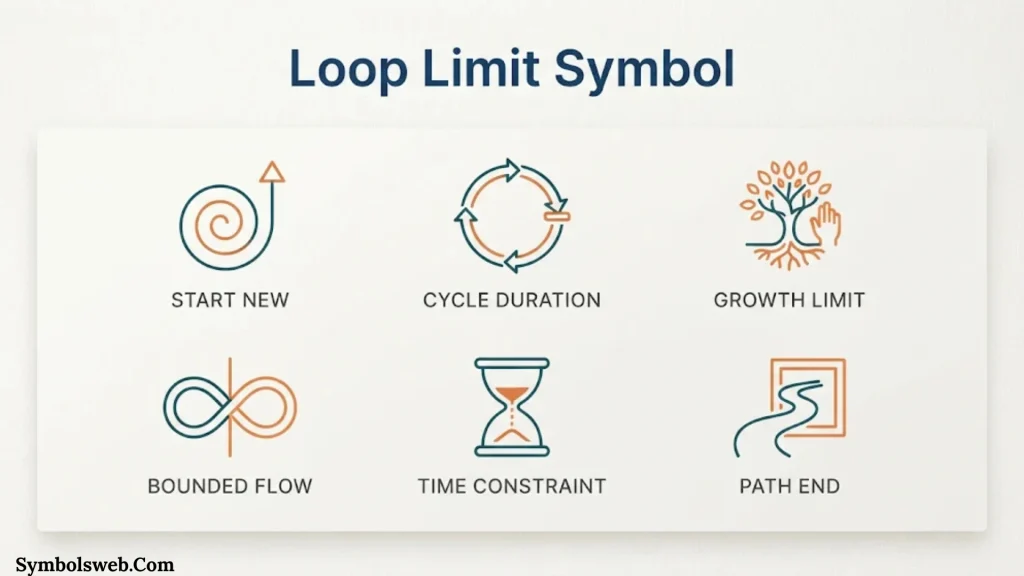
The loop limit symbol identifies the beginning or ending boundary of a repeated process in certain technical flowchart conventions. It helps define the conditions under which a loop operates.
For example, a program may repeat a task until it reaches ten attempts.
A loop limit can also represent a maximum number of records or processing cycles.
When to use it: Use a loop-related symbol when a process repeats within a defined boundary. For simple diagrams, a decision diamond with a return arrow may communicate the loop more clearly.
Iteration Symbol
The iteration symbol represents a repeated operation. It is useful in algorithms and workflows that process several items using the same steps.
For example, a program may check each item in a shopping cart. It repeats the same calculation until it has processed every item.
When to use it: Use an iteration symbol when an operation repeats until a condition is met or a collection is complete.
Parallel Mode Symbol
The parallel mode symbol represents activities that can happen at the same time.
Consider an online order. After payment approval, the system might:
- Send an order confirmation.
- Update inventory.
- Notify the warehouse.
These activities can happen independently or at the same time.
When to use it: Use a parallel mode symbol when a process contains concurrent activities.
Synchronization Symbol
The synchronization symbol represents a point where parallel activities coordinate or wait for one another before continuing.
For example, an order may require both payment confirmation and inventory confirmation before shipment begins.
The synchronization point ensures that the next step does not start too early.
When to use it: Use synchronization when multiple branches must reach a coordinated point before the workflow continues.
Transfer Symbol
The transfer symbol represents the movement of information, material, or control from one location or system to another.
Examples include:
- Transfer a file to another server
- Send a request to an external system
- Move a product to another department
- Forward a transaction for processing
When to use it: Use a transfer symbol when movement between systems, locations, or process areas needs special attention.
Data Symbol
The data symbol represents information used or produced by a process. In many basic flowcharts, the parallelogram serves this purpose.
For example, a sales system may receive customer details, process an order, and produce a sales record.
The exact symbol depends on the diagram’s notation and the type of data operation.
When to use it: Use a data symbol when information is central to the activity being described.
Extract Symbol
The extract symbol represents selecting or separating a portion of data from a larger collection.
For example, a reporting system may extract all sales transactions from a particular month.
The selected records can then move to another process for analysis.
When to use it: Use an extract symbol when a workflow selects specific records or information from a larger dataset.
Stored Data Symbol
The stored data symbol represents information retained for later access. Its appearance may vary across flowchart standards and software tools.
Examples include:
- Customer database
- Product catalog
- Employee records
- Transaction history
- Archived reports
A stored-data symbol is useful when the flowchart needs to show where information remains after the current operation finishes.
When to use it: Use this symbol when the process reads from or writes to stored information.
Sequential Access Storage Symbol
The sequential access storage symbol represents a storage medium where data is accessed in sequence.
Magnetic tape is a common example. To reach a particular record, a system may need to move through preceding data.
This differs from direct-access storage, where a system can reach a particular location without reading every earlier record.
When to use it: Use this symbol when the storage method requires sequential reading or writing.
Flowchart Symbols for Data Processing and Programming
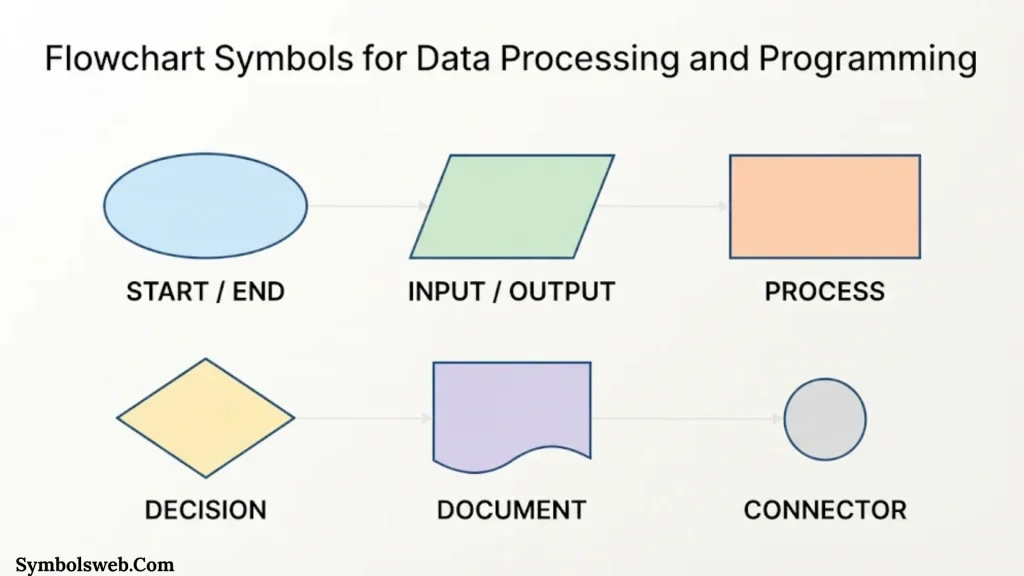
Flowcharts are especially useful in software development because they show how an algorithm handles information. They can represent calculations, conditions, loops, data storage, and output.
Input and Output in Program Flowcharts
Program flowcharts often use input/output symbols to show where information enters or leaves an algorithm.
For example, a temperature-conversion program may:
- Accept a temperature in Fahrenheit.
- Convert the value to Celsius.
- Display the result.
The input symbol represents the original temperature. The process rectangle represents the conversion. The output symbol represents the final value.
Decision and Loop Symbols in Algorithms
A decision diamond checks whether a condition is true or false.
For example, a program that checks a user’s age might ask:
Is the user at least 18 years old?
- Yes: Continue to the next step.
- No: Display an age restriction message.
Loops use flowlines that return to an earlier step. A decision diamond often controls whether the loop repeats or finishes.
For example, a program may keep asking for a valid password until the user enters the correct one or reaches a maximum number of attempts.
Data Storage in Program Flowcharts
Programs often read and save information. A data storage symbol can show where records are stored or retrieved.
For example, a banking application may:
- Receive an account number.
- Retrieve the account record.
- Check the available balance.
- Process a transaction.
- Save the updated balance.
This makes the relationship between processing and stored information easier to understand.
How to Choose the Correct Flowchart Symbol
Choosing the right symbol depends on what happens at each step. Start by identifying the activity rather than choosing a shape based on appearance.
Use these questions:
- Is the process starting or ending? Choose a terminator.
- Is someone or something performing an action? Choose a process symbol.
- Does the next step depend on an answer? Choose a decision symbol.
- Is information entering or leaving? Choose an input/output symbol.
- Is a person entering information? Choose a manual input symbol.
- Is a person performing a physical task? Choose a manual operation symbol.
- Does the workflow create a document? Choose a document symbol.
- Does the process pause? Choose a delay symbol.
- Do separate paths join? Choose a merge symbol or a clear joining flowline.
- Does the workflow continue elsewhere? Choose the appropriate connector.
Flowchart Symbol Selection Table
| What happens in the process? | Recommended symbol |
| The workflow begins | Terminator |
| The workflow finishes | Terminator |
| A task is performed | Process |
| A condition is checked | Decision |
| Information is entered | Input/Output or manual input |
| Results are displayed | Input/Output or display |
| A person performs a task | Manual operation |
| A document is generated | Document |
| Several documents are generated | Multiple documents |
| The process waits | Delay |
| Two paths come together | Merge or joined flowlines |
| A section continues on another page | Off-page connector |
| A reusable procedure is called | Predefined process |
| Information is saved | Data storage or stored data |
Use the simplest symbol that accurately describes the activity. A diagram becomes harder to understand when it includes specialized shapes that add no useful meaning.
ANSI and ISO Flowchart Symbols and Standards
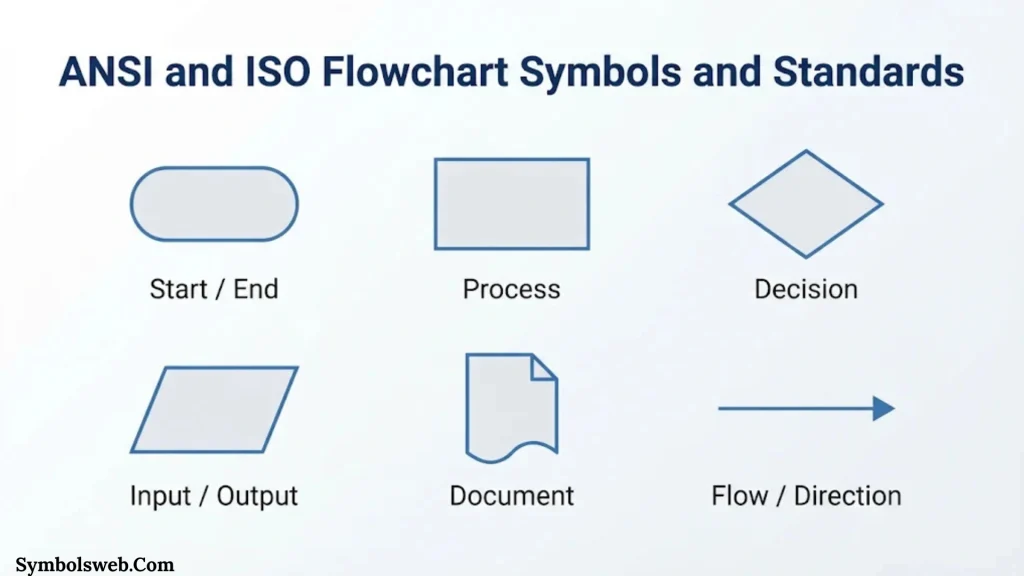
Flowchart symbols have developed through different standards and technical conventions. Two important names are ANSI and ISO.
ANSI Flowchart Symbols
ANSI stands for the American National Standards Institute. It coordinates voluntary standards in the United States.
ANSI-related flowchart conventions have influenced the way many American organizations document processes and systems.
You may see references to older ANSI flowcharting standards in textbooks and technical documentation. However, not every flowchart created in the United States follows one identical symbol set.
ISO Flowchart Symbols
ISO stands for the International Organization for Standardization. Its standard ISO 5807:1985 covers documentation symbols and conventions for data, program, and system flowcharts. It also addresses program network charts and system resources charts.
The standard provides guidance for representing operations, data, flow direction, and related diagram elements. ISO’s official record states that the standard was reviewed and confirmed in 2019. It remains the current published edition.
You can check its scope and status on the official ISO 5807 page.
ANSI vs. ISO: What Is the Difference?
| Feature | ANSI-related conventions | ISO 5807 |
| Organization | American National Standards Institute | International Organization for Standardization |
| Main relevance | US standards environment | International documentation |
| Application | Business and technical diagrams | Data, program, and system flowcharts |
| Symbol usage | Depends on the applicable convention | Defines documentation symbols and rules |
| Main goal | Consistent technical communication | Consistent technical communication |
The two approaches share many familiar shapes. For example, rectangles commonly represent processes and diamonds commonly represent decisions.
However, detailed conventions and symbol definitions may differ. If your organization requires compliance, consult the exact standard or internal documentation rules rather than assuming every symbol is interchangeable.
How to Read a Flowchart
Reading a flowchart becomes easier when you understand its starting point, direction, and decision branches.
Most simple flowcharts follow a top-to-bottom or left-to-right direction. Arrows show how the process moves between symbols.
Follow these steps when reading one:
Start at the Terminator
Find the symbol labeled “Start,” “Begin,” or another starting instruction.
This identifies the first step in the workflow.
Follow the Flowlines
Follow each arrow to the next connected symbol. Don’t jump between shapes simply because they appear close together.
The arrows show the intended sequence.
Read Process Labels
Read each rectangle as an action. For example, “Calculate Total” means the system or person performs that operation.
Pay Attention to Decision Diamonds
A diamond introduces a condition. Read the question and identify the labels on its outgoing branches.
For example:
- Yes: Continue to approve.
- No: Return to the application form.
Follow Connectors
If you encounter a connector, look for the matching label elsewhere in the diagram.
On-page connectors link sections on the same page. Off-page connectors point to another page or diagram.
Find the Ending
Follow the arrows until you reach a terminator labeled “End,” “Finish,” or another final state.
Some flowcharts have multiple ending points because different outcomes can finish the process.
Practical Flowchart Examples Using Standard Symbols
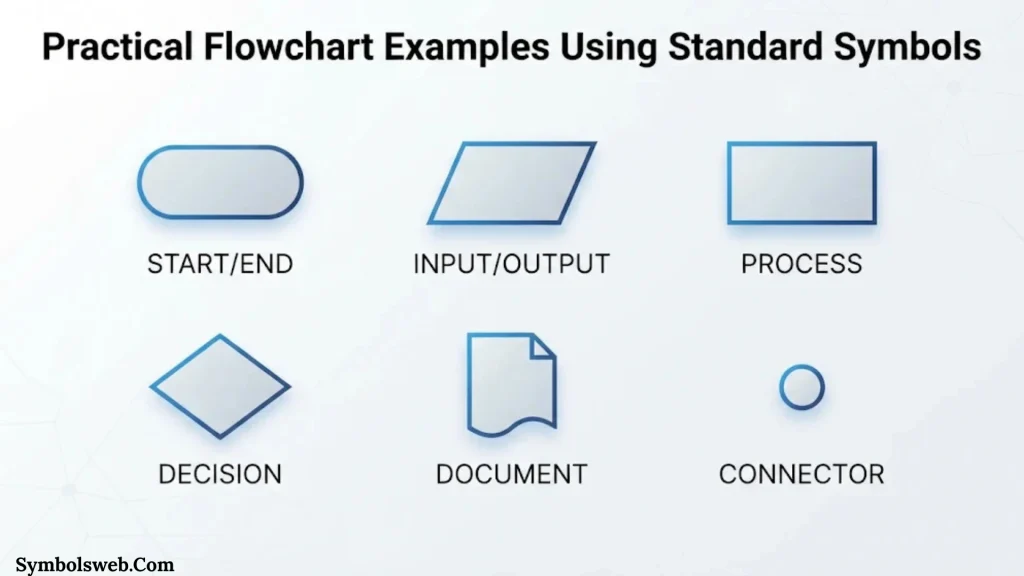
Examples make flowchart symbols easier to understand. The following workflows show how common shapes work together.
Example 1: User Login Flowchart
A login process checks whether a user has entered valid account details.
The process follows these steps:
- Start: The user opens the login page.
- Input: The user enters a username and password.
- Process: The system checks the submitted details.
- Decision: Are the credentials correct?
- Yes: The system opens the user’s account.
- No: The system displays an error message.
- End: The login attempt finishes.
This example uses a terminator, input symbol, process symbol, decision diamond, and output step.
Example 2: Online Shopping Flowchart
An online shopping workflow explains how a customer moves from product selection to order confirmation.
The main steps include:
- Start shopping.
- Select a product.
- Add the product to the cart.
- Check product availability.
- Enter shipping information.
- Submit payment details.
- Verify payment.
- Confirm the order or display an error.
- Finish the transaction.
A decision diamond checks stock availability. Another decision checks payment approval.
The workflow may also include parallel activities after payment, such as updating inventory and sending a confirmation email.
Example 3: Employee Leave Approval Flowchart
An employee leave workflow shows how a manager or HR department handles a request.
The process may include:
- Employee submits a leave request.
- The system records the request.
- The manager reviews the details.
- The manager checks the available leave balance.
- A decision determines whether the request is approved.
- HR receives the approved request or the employee receives a rejection message.
- The process ends.
This example uses input/output, process, and decision symbols.
A document symbol may also represent the leave application or approval record.
Example 4: Customer Service Flowchart
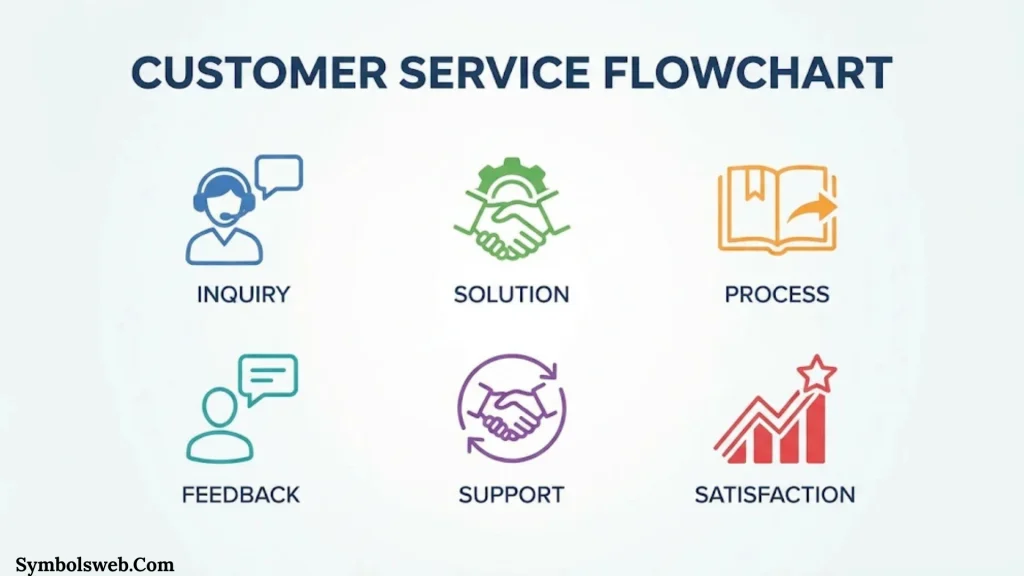
A customer service workflow helps staff respond to complaints and support requests.
A typical process looks like this:
- Receive customer complaints.
- Create a support ticket.
- Identify the issue.
- Check whether the support team can resolve it.
- Provide a solution or escalate the ticket.
- Confirm whether the customer is satisfied.
- Close the ticket or continue investigating.
Decision symbols help staff choose the right response. A delay symbol can show a waiting period when the team needs information from another department.
Example 5: Data Processing Flowchart
A data-processing flowchart shows how information moves through a computer system.
A basic workflow may include:
- Receive input data.
- Validate the information.
- Reject invalid records.
- Process valid records.
- Save the results.
- Generate a report.
- Display or print the output.
This workflow can use input/output, decision, process, stored-data, and document symbols.
Example 6: Simple Algorithm Flowchart
An algorithm flowchart explains the logic behind a sequence of instructions.
Consider an algorithm that checks whether a number is even or odd.
The steps are:
- Start.
- Enter a number.
- Check whether the number is divisible by two.
- If the remainder is zero, display “Even.”
- Otherwise, display “Odd.”
- End.
This example demonstrates how a decision symbol creates two possible paths from one condition.
Common Flowchart Symbols That People Confuse
Some flowchart symbols look similar. Understanding their differences prevents mistakes and makes diagrams more accurate.
Process vs. Predefined Process
| Process symbol | Predefined process symbol |
| Represents an ordinary activity | Represents a separately defined procedure |
| Usually a plain rectangle | Rectangle with additional vertical lines |
| Describes a task in the current workflow | References a reusable or documented process |
| Example: Calculate tax | Example: Run tax calculation routine |
Use a standard process symbol for an action that belongs directly in the current diagram. Use a predefined process symbol when the detailed procedure exists elsewhere.
Input/Output vs. Manual Input
| Input/Output | Manual input |
| Represents information entering or leaving | Represents information entered by a person |
| Usually a parallelogram | Usually a slanted-top shape |
| Includes system-generated output | Focuses on human entry |
| Example: Display report | Example: Type email address |
A manual input symbol provides more detail about who or what supplies the information.
Manual Input vs. Manual Operation
| Manual input | Manual operation |
| A person enters information | A person performs an activity |
| Often involves a keyboard or form | May involve physical work |
| Example: Enter product quantity | Example: Inspect a package |
The distinction matters in workflows where human tasks and data entry need separate tracking.
Document vs. Multiple Documents
| Document | Multiple documents |
| Represents one document | Represents a group of documents |
| Single document shape | Overlapping document shapes |
| Example: Invoice | Example: Invoice, receipt, and order summary |
Use the multiple-documents symbol when several related documents belong to one process step.
On Page vs. Off Page Connector
| On page connector | Off page connector |
| Links sections on the same page | Links sections across pages |
| Usually a small circle | Commonly a pentagon |
| Helps avoid long lines | Helps organize multi-page diagrams |
The labels should match so readers can follow the connection without guessing.
Merge vs. Decision
| Merge | Decision |
| Combines separate paths | Creates branches based on a condition |
| Often represented by an inverted triangle in some conventions | Shown as a diamond |
| Multiple incoming paths may join | One incoming path leads to different outcomes |
| Example: Combine two completed approval paths | Example: Is the request approved? |
A decision separates a process into alternatives. A merge brings separate paths together.
How to Create a Flowchart Step by Step
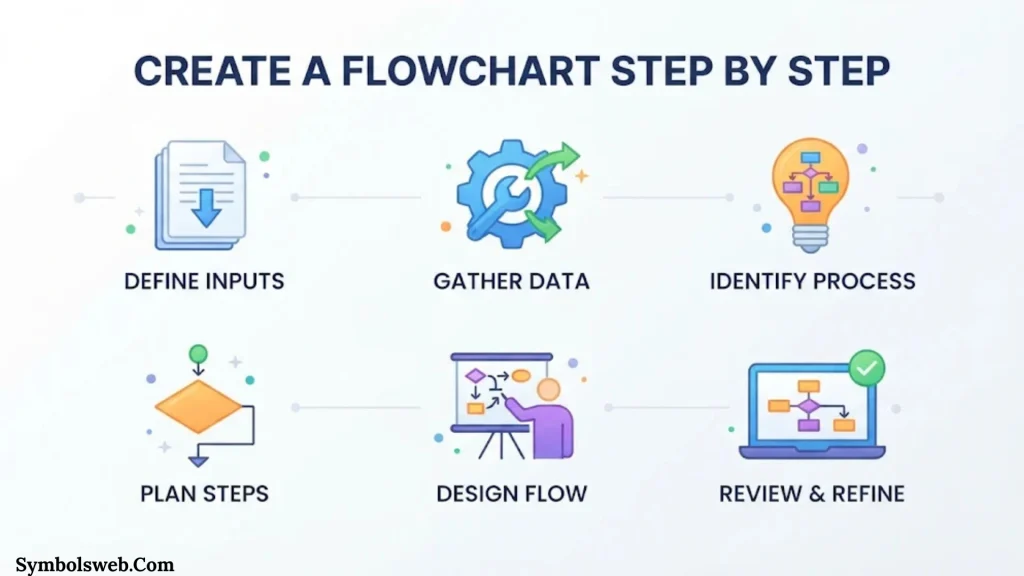
You don’t need advanced design skills to create a useful flowchart. A clear process description and consistent symbol use are usually enough.
Define the Process
Decide what the flowchart needs to explain.
For example, you might want to document:
- A customer refund process
- An employee onboarding procedure
- A website registration workflow
- A software algorithm
- A product delivery process
Keep the scope manageable. A diagram that tries to explain an entire organization can become difficult to follow.
Identify the Starting and Ending Points
Write down where the process begins and what counts as completion.
A refund workflow might begin when a customer submits a refund request. It could end when the refund is approved or rejected.
List Every Important Step
Write the activities in their correct order before drawing anything.
Include:
- Actions
- Decisions
- Data inputs
- Outputs
- Waiting periods
- Documents
- Connections to other processes
This list becomes the foundation of your diagram.
Identify Decision Points
Look for questions that change the direction of the process.
Examples include:
- Is the information complete?
- Does the customer qualify?
- Is the payment successful?
- Has the manager approved the request?
Write the possible outcomes clearly. Most simple decisions use Yes and No branches.
Select the Correct Symbols
Choose a shape for each activity based on its function.
Use rectangles for tasks, diamonds for decisions, and parallelograms for input or output.
Avoid adding specialized symbols unless they improve understanding.
Connect the Symbols
Use arrows to show the correct order.
Make sure every branch leads somewhere meaningful. A decision branch should not end unexpectedly unless that outcome intentionally finishes the process.
Review the Diagram
Check whether someone unfamiliar with the process can follow it.
Ask yourself:
- Does the flowchart have a clear starting point?
- Does every action have an understandable label?
- Are decision branches labeled?
- Do connectors point to the correct locations?
- Are any steps missing?
- Does every path reach a logical ending?
Test the Flowchart
Walk through the diagram using realistic examples.
For a refund workflow, test at least two situations:
- A customer qualifies for a refund.
- A customer doesn’t qualify for a refund.
If the flowchart handles both situations correctly, it’s more likely to represent the real process.
Flowchart Best Practices for Clear and Professional Diagrams
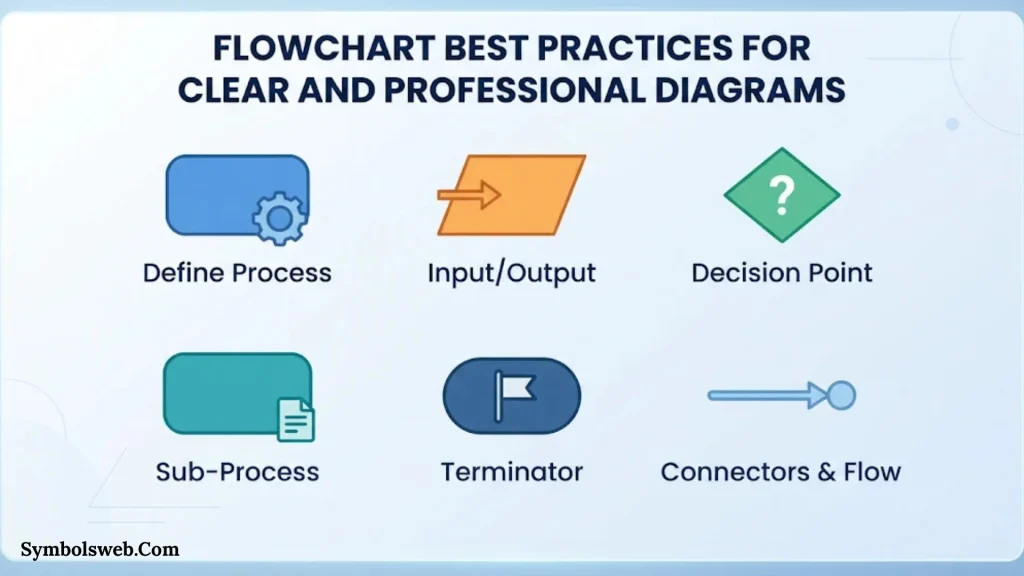
A flowchart should communicate information quickly. Good design helps readers understand the process without unnecessary effort.
Keep Each Symbol Focused
Use one main action or idea per symbol whenever practical.
Instead of writing “Check payment, update account, send email, and close order” inside one rectangle, divide these tasks into separate steps.
This makes the workflow easier to maintain and troubleshoot.
Use Clear Labels
Write short, specific descriptions inside each shape.
Good labels include:
- Verify account
- Calculate total
- Save customer record
- Approve request
Avoid vague labels such as “Do work” or “Handle information.”
Maintain a Consistent Direction
Most flowcharts work best when they move from top to bottom or left to right.
A consistent direction reduces confusion and makes arrows easier to follow.
Label Decision Branches
Every important decision branch should have a clear outcome.
For example, a diamond labeled “Is the account active?” could have two arrows:
- Yes
- No
Without these labels, readers may not know which route to follow.
Avoid Crossing Flowlines
Crossing arrows can make a diagram difficult to understand.
Use connectors or reorganize the layout when lines overlap.
Keep the Design Simple
Use a consistent font, balanced spacing, and readable labels.
Color can help distinguish departments or stages. However, color should support the symbols rather than replace their meaning.
Use Connectors for Large Diagrams
Large diagrams often become cluttered when every step connects through a long arrow.
On-page and off-page connectors help divide the workflow into manageable sections.
Update the Flowchart When Processes Change
A flowchart should reflect the real process.
If a company changes its approval rules, software, or responsibilities, update the diagram as well. Outdated flowcharts can lead to mistakes and wasted time.
Where Are Flowchart Symbols Used?
Flowchart symbols are useful in many industries because nearly every organization has processes that need to be explained or improved.
Software Development
Developers use flowcharts to plan algorithms, understand program logic, and document system behavior.
They can map loops, conditions, inputs, outputs, and error-handling steps before writing code.
Business Process Management
Businesses use flowcharts to document workflows such as purchasing, hiring, customer support, and invoice approval.
Managers can use these diagrams to identify bottlenecks and unnecessary activities.
Manufacturing
Manufacturing teams use process flowcharts to explain production stages, inspections, equipment operations, and quality-control procedures.
A diagram can show where materials enter the production line and where finished products leave it.
Education
Teachers use flowcharts to explain problem-solving methods, scientific processes, and decision-making.
Students can also use them to organize ideas and understand how one action leads to another.
Healthcare
Healthcare organizations use flowcharts to document administrative procedures, patient registration, appointment scheduling, and other operational workflows.
Clinical protocols may require specialized, carefully reviewed documentation.
Project Management
Project teams use flowcharts to explain task dependencies, approval processes, and project workflows.
They can help team members understand what needs to happen before the next stage begins.
Customer Service
Support departments use flowcharts to standardize complaint handling, ticket escalation, refunds, and troubleshooting.
These diagrams can help staff provide consistent responses.
Popular Tools for Creating Flowcharts
Several diagramming tools let you create flowcharts using ready-made shapes and connectors. The best choice depends on your workflow, budget, and collaboration needs.
Microsoft Visio
Microsoft Visio is a diagramming application used for flowcharts, process maps, network diagrams, and technical documentation.
It provides shape libraries and diagram templates. It’s especially useful in organizations that already use Microsoft products.
Lucidchart
Lucidchart is a web-based diagramming tool. It supports flowcharts, process maps, organizational charts, and collaborative diagram editing.
Its templates can help beginners create diagrams without designing every shape from scratch.
Draw.io (diagrams.net)
diagrams.net, formerly known as draw.io, is a diagramming tool that supports flowcharts and many other diagram types.
It offers a browser-based editor and desktop applications. It’s a practical option for people who want to create diagrams without starting with a paid enterprise tool.
SmartDraw
SmartDraw provides templates and diagramming features for flowcharts, floor plans, organizational charts, and process diagrams.
It can be useful for business users who want structured templates and a straightforward diagramming experience.
Google Drawings
Google Drawings can create simple diagrams using shapes, lines, and text boxes.
It may suit basic workflows and users who want to work within Google’s productivity environment.
Frequently Asked Questions About Flowchart Symbols
What Are the Five Basic Flowchart Symbols?
The five basic flowchart symbols are the terminator, process, decision, input/output, and flowline. They represent the start or end, an action, a condition, data movement, and the direction of the workflow.
These symbols are enough for many simple diagrams.
What Does a Diamond Mean in a Flowchart?
A diamond represents a decision. It shows a question or condition that determines which path the process follows.
For example, “Is the payment approved?” can create Yes and No branches.
What Does a Rectangle Mean in a Flowchart?
A rectangle represents a process or action. It shows an activity performed by a person, computer, or system.
Examples include calculating a total, updating a record, and checking an account.
What Does an Oval Mean in a Flowchart?
An oval or rounded rectangle usually represents a terminator. It marks where a process begins or ends.
Common labels include Start, Begin, End, and Finish.
What Does a Parallelogram Mean in a Flowchart?
A parallelogram represents input or output. It shows information entering a system or leaving it.
Examples include entering customer details and displaying a report.
What Does an Arrow Mean in a Flowchart?
An arrow represents a flowline. It shows the direction in which the process moves from one symbol to another.
Arrows help readers follow the correct sequence of activities.
What Is the Difference Between a Process and a Decision Symbol?
A process symbol is a rectangle that represents an action. A decision symbol is a diamond that represents a question or condition.
For example, “Calculate tax” is a process. “Is the customer eligible?” is a decision.
What Is the Difference Between a Flowchart and a Process Map?
A flowchart uses standardized shapes and arrows to represent the steps and logic of a process.
A process map is a broader term for a visual representation of how work happens. It may include responsibilities, departments, timelines, and other details.
The terms sometimes overlap. Their exact meaning depends on the organization and the diagram’s purpose.
What Is the ISO Standard for Flowchart Symbols?
ISO 5807:1985 is an international standard covering documentation symbols and conventions for data, program, and system flowcharts. It also covers program network charts and system resources charts.
The International Organization for Standardization reviewed and confirmed this edition in 2019. It remains the current published edition.
Do All Flowcharts Use the Same Symbols?
No. Many flowcharts share common shapes, but specialized diagrams may use additional symbols or different conventions.
The symbol set depends on the diagram’s purpose, industry, and applicable standard.
Can You Create a Flowchart Without Special Software?
Yes. You can draw a simple flowchart using paper and a pencil, presentation software, or a general-purpose drawing tool.
Dedicated diagramming applications become more useful when you need templates, automatic connectors, collaboration, or large diagrams.
Why Should You Use Standard Flowchart Symbols?
Standard symbols make diagrams easier to understand and share. They help readers recognize actions, decisions, data, and connections without learning a new visual language for every workflow.
They also support consistent process documentation across teams.
Conclusion
Flowchart symbols make complex processes easier to understand by turning actions, decisions, data, and connections into clear visual steps. The terminator, process, decision, input/output, and flowline symbols form the foundation of most everyday diagrams. Specialized shapes add detail when a workflow involves documents, manual tasks, data storage, delays, or parallel operations.
The most important rule is to choose symbols based on what each step actually does. Keep labels clear, connect the shapes logically, and make every decision branch easy to follow. When you use consistent flowchart symbols and meanings, your diagrams become more useful for planning, communication, training, and problem solving.

Jordan Hayes is a writer with a passion for exploring the history, meanings, and cultural significance behind symbols from around the world. He enjoys turning complex topics into clear, engaging content that anyone can understand. Jordan is also the fictional author of The Silent Language of Ancient Marks and Hidden Symbols Beyond the Surface, two original book concepts created for his author profile. When he’s not writing, he spends time researching myths, traditions, and forgotten stories that inspire his work. His goal is to help readers discover the deeper meanings behind the symbols they encounter every day.
 Eliana Foster